At a glance
- Role
- Product owner and designer, building with Claude Code
- Team
- Solo, with Claude Code writing the code
- Tools
- SwiftUI, SwiftData, MapKit, HealthKit, Garmin Connect IQ, Firebase, OpenRouteService, MapLibre, Claude Code
- Timeline
- October 2026
- Status
- In development: eight phases built and tested in the iPhone simulator, with rides on my own bike next. For my own use, so not in the App Store
What it shows
- Designing for a glance: readable in under a second, with gloves on and in sunlight
- A phone and a watch working together, each number from its best source
- Honest data: estimates labelled, gaps shown as gaps
- Ride modes that trade a live screen for battery, and wake the phone for each turn
- Battery treated as a design constraint, and measured
- Directing an AI build: spec, product plan, design review, phased delivery
Highlights
- 77 screens designed and built in SwiftUI, every one reviewed
- 133 automated tests
- 8 build phases, from heart rate to offline maps, all committed on 8 October 2026
Discover
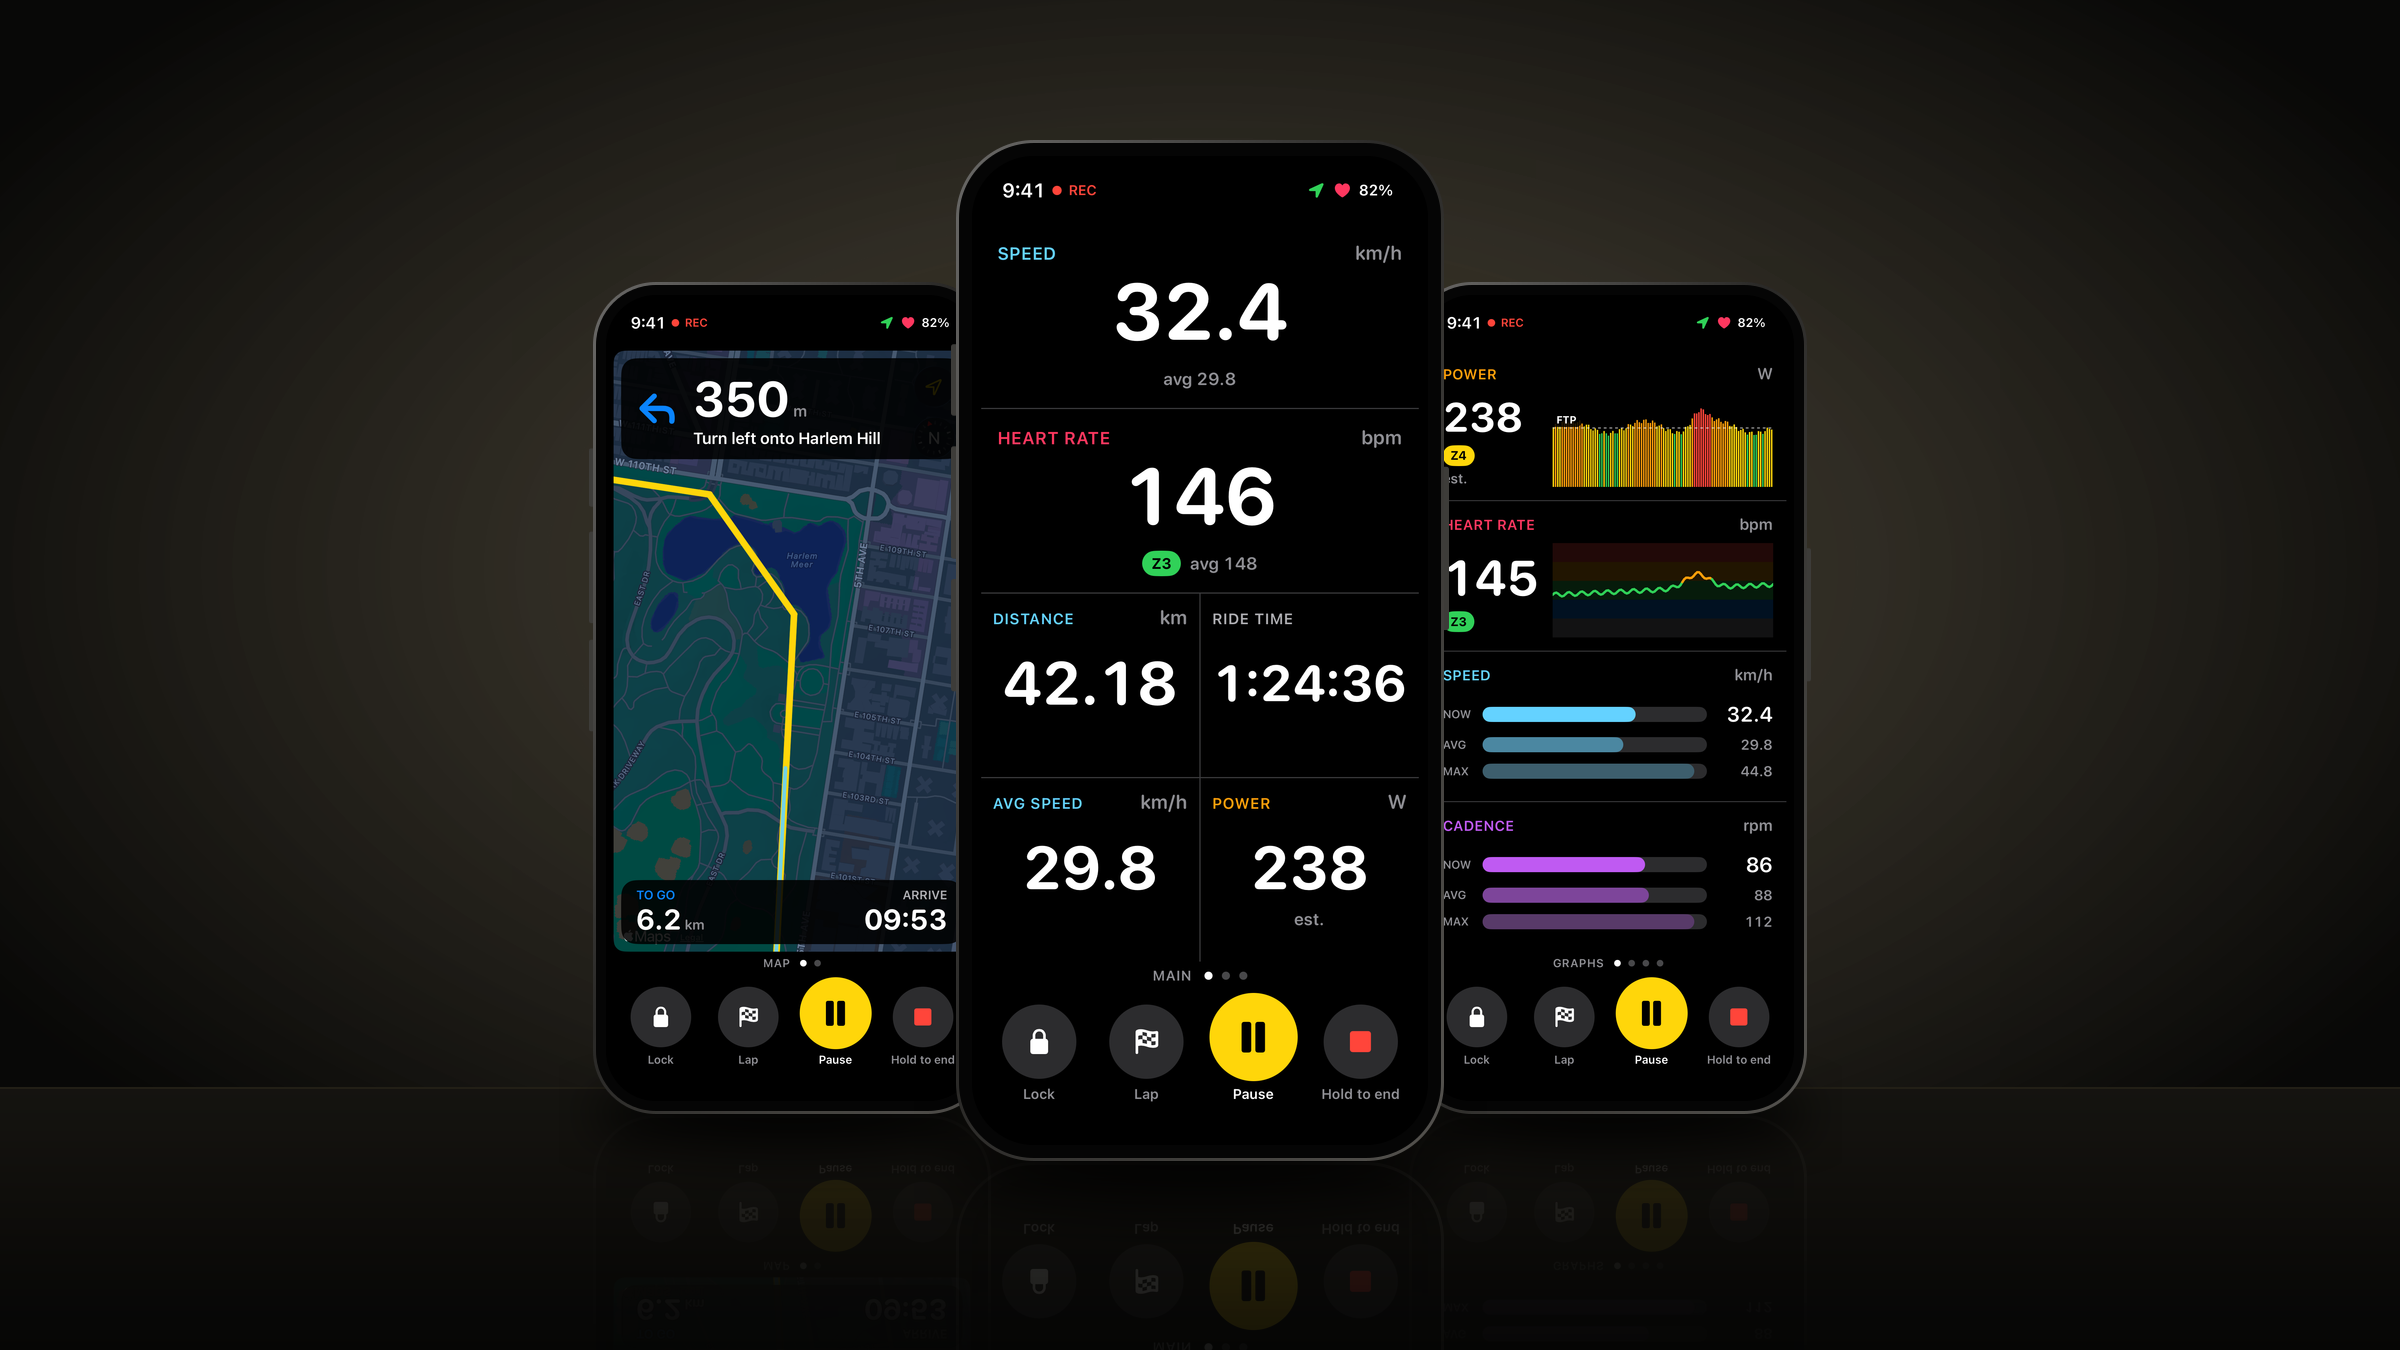
BikeComp turns my iPhone into a cycling computer. It sits on the handlebars and shows the ride as big, glanceable numbers on pages I set up myself. It plans routes and gives turn-by-turn directions out loud, controls Apple Music or Spotify, and estimates power from speed and gradient when there’s no power meter. It also connects to the Garmin Forerunner I wear, so the watch keeps recording the ride while the phone shows its heart rate and more. Three ride modes trade a live screen for battery life, and the map can be downloaded for riding without signal. Every ride is saved with its map, zones, splits and best efforts, and can go to Apple Health and my own online account.
It’s for one rider: me. It isn’t for the App Store, and it runs on Apple’s free developer account.
The cycling apps I tried were fine, but their full features sat behind subscriptions, and none offered a live connection to my Garmin. I knew how to build one, so I did.
How I built it
Building it this way was part of the point. Projects like this keep me at the forefront of AI-assisted development and new tech, and teach me new ways to bring my ideas to life.
Each phase ran through the same loop:
- Spec and planWhat the phase delivers, against the product principles
- My directionDecisions on each open question, with options and a recommendation
- BuildClaude Code wrote the code and its automated tests
- Simulator checkFake GPS rides, tapped through screen by screen, every screen photographed
- CommitOne commit per phase, with anything that needs me batched for the end
How it came together
8 steps · 3 reworks · 1 milestone
- Step
- Rework: went back and changed something
- Milestone
1DiscoverEarly October 2026
A spec
A battery-efficient iPhone cycling computer for one rider: custom data pages, my Garmin for heart rate, navigation, music and a power estimate. Swift 6 and SwiftUI, and only two outside code libraries allowed: Spotify’s and Garmin’s.
Reworked later in03
Phase 1: heart rate from the watch
A Bluetooth link to my Forerunner 965. Testing found the watch only sends heart rate while its own phone link is switched off.
Reworked later in09
2Define8 October
From a prototype to a finished product
A product plan replaced the spec’s phase order: every screen designed and every state handled (empty, offline, permission denied, sensor lost), seven product principles, and rides synced to my own account.
Why: Phase 1’s bare heart-rate screen showed that a working prototype wasn’t enough. I wanted in-depth detail, very functional UI and UX, and rides saved to an account.
Reworked later in04
3Design8 October
Designed in SwiftUI instead of Figma
Back to 03: From a prototype to a finished product
The design system and screens were built straight in SwiftUI, with a gallery that shows any screen with sample data. The Figma file keeps the colour tokens and text styles.
Why: The plan was Figma first, but Figma’s free plan allows the AI connector only 20 calls a month, and they ran out mid-design.
Design review
Every screen photographed in the simulator at my phone’s size, on one review page. I approved it and asked for Garmin-style graph fields, which were added.
4Deliver8 October
Recording, accounts and analysis
Ride recording with crash recovery, Firebase accounts, custom pages, the power estimate, the Lock Screen, then ride analysis, records and trends.
Routes, navigation and music
A route planner, turn-by-turn directions read out loud, GPX import, and Apple Music and Spotify controls.
Ride buttons down the side
At my request: the buttons can run down the right or left edge, where a thumb reaches them with hands on the bars, and music joined them.
A watch link that keeps the Garmin recording
Back to 02: Phase 1: heart rate from the watch
BikeComp Link, a Garmin data field, runs inside the watch’s own Bike activity and sends its data to the phone every second.
Why: Broadcasting heart rate needs the watch’s phone link off, and I wanted to keep recording my rides on the Garmin as usual.
Apple Health, onboarding and a battery review
Rides saved to Apple Health, phone and watch data used together, a first-launch set-up, and a fix for screens redrawing during rides.
Research, then Phase 8
Research into offline maps, earbud sensors and other wearables led to my decisions: three ride modes with turn wakes, earbud heart rate and a turn chime, 75 Garmin models, and maps that download for offline rides. No Apple Watch app.
5Outcome8 October
Ready for the bike
All eight phases built and tested in the simulator. Real rides come next.
Define
Principles
Every screen was checked against seven principles, set out in the product plan before any design started.
- Readable in under a secondOne number per field: huge and white, with a small label and unit.
- Works with gloves, rain and bumpsRide buttons are at least 64 points, against Apple’s minimum of 44. Ending a ride needs a press and hold.
- Readable in sunlightWhite numbers on true black. Colour shows the kind of metric, but never carries meaning on its own.
- Nothing is ever lostThe ride saves while it records, and a crash or a dead battery offers to recover it.
- Honest dataEstimates are labelled est. Gaps stay gaps, never filled with guesses.
- Battery is a featureUpdates once a second, a black interface, and a live map only on the Map page.
- Native iOSSystem components, SF Symbols, haptics at key moments and VoiceOver labels throughout.
The limits it had to work within
- Apple’s free developer account. The app has to be reinstalled every seven days, and iCloud, push notifications and WeatherKit aren’t available. Apple Health is.
- An iPhone 16. No always-on display, and the screen is the biggest drain on the battery.
- Two outside code libraries. Spotify’s and Garmin’s only, so accounts run on Firebase’s web interfaces rather than its app library.
- The watch. My Forerunner only broadcasts heart rate with its phone link off, and a Garmin data field has little memory and can’t read the raw motion sensors.
Design
Designed for a glance
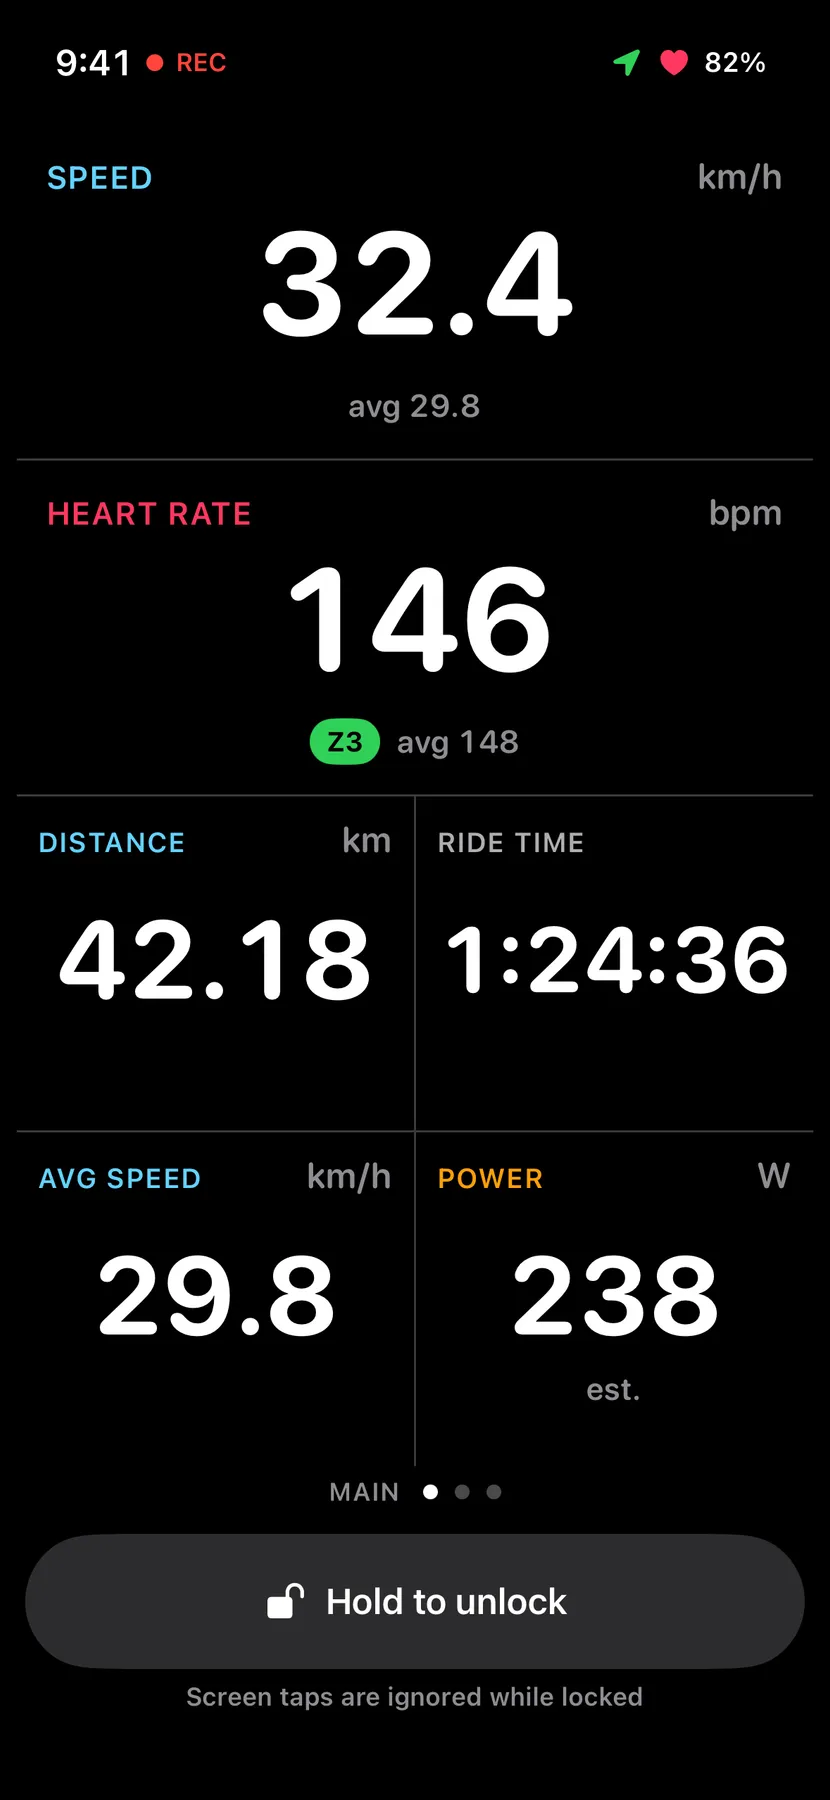
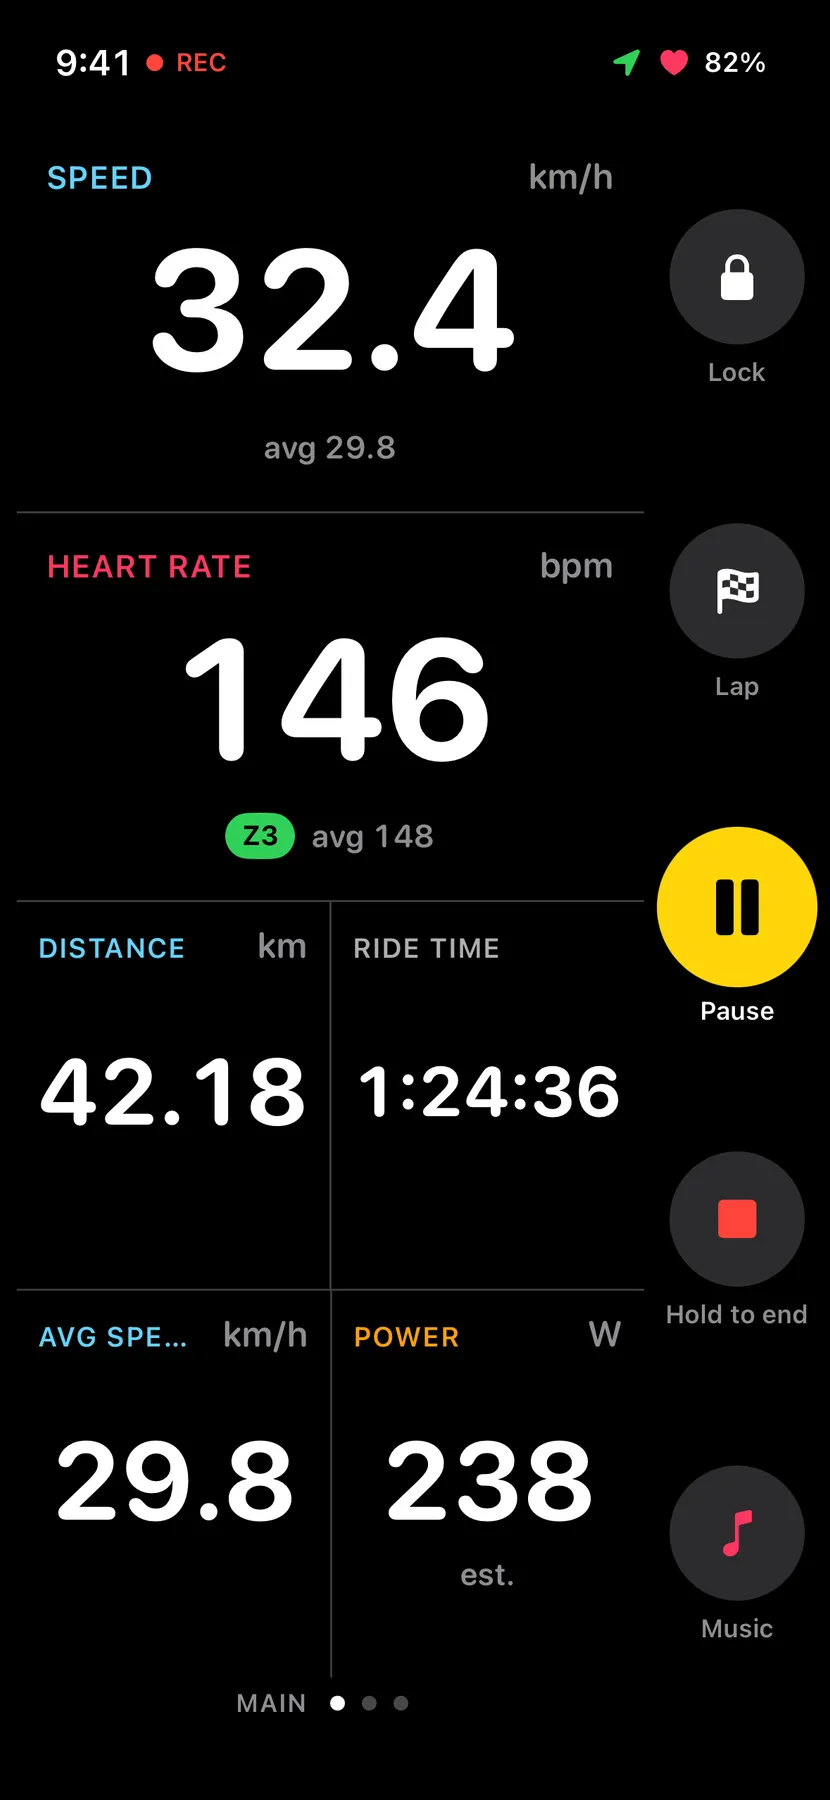
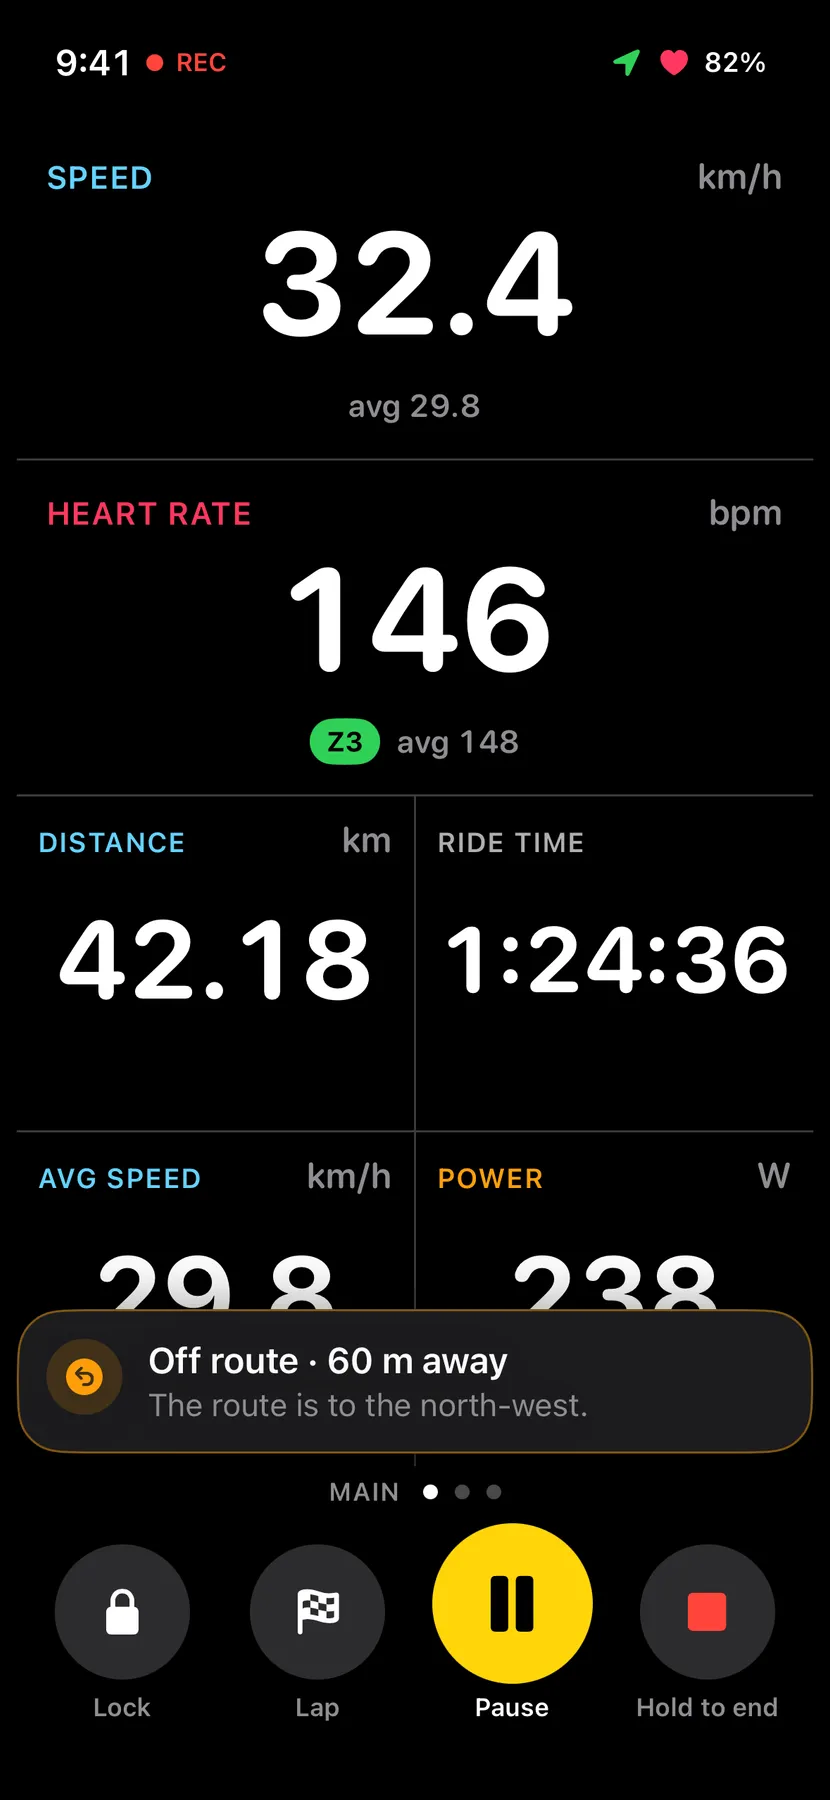
The ride screen is true black, so the phone’s OLED pixels stay off, with white numbers in SF Pro Rounded. Each kind of metric has its own colour, used only for labels: blue for speed and distance, red for heart rate, orange for power, green for climbing, purple for cadence.
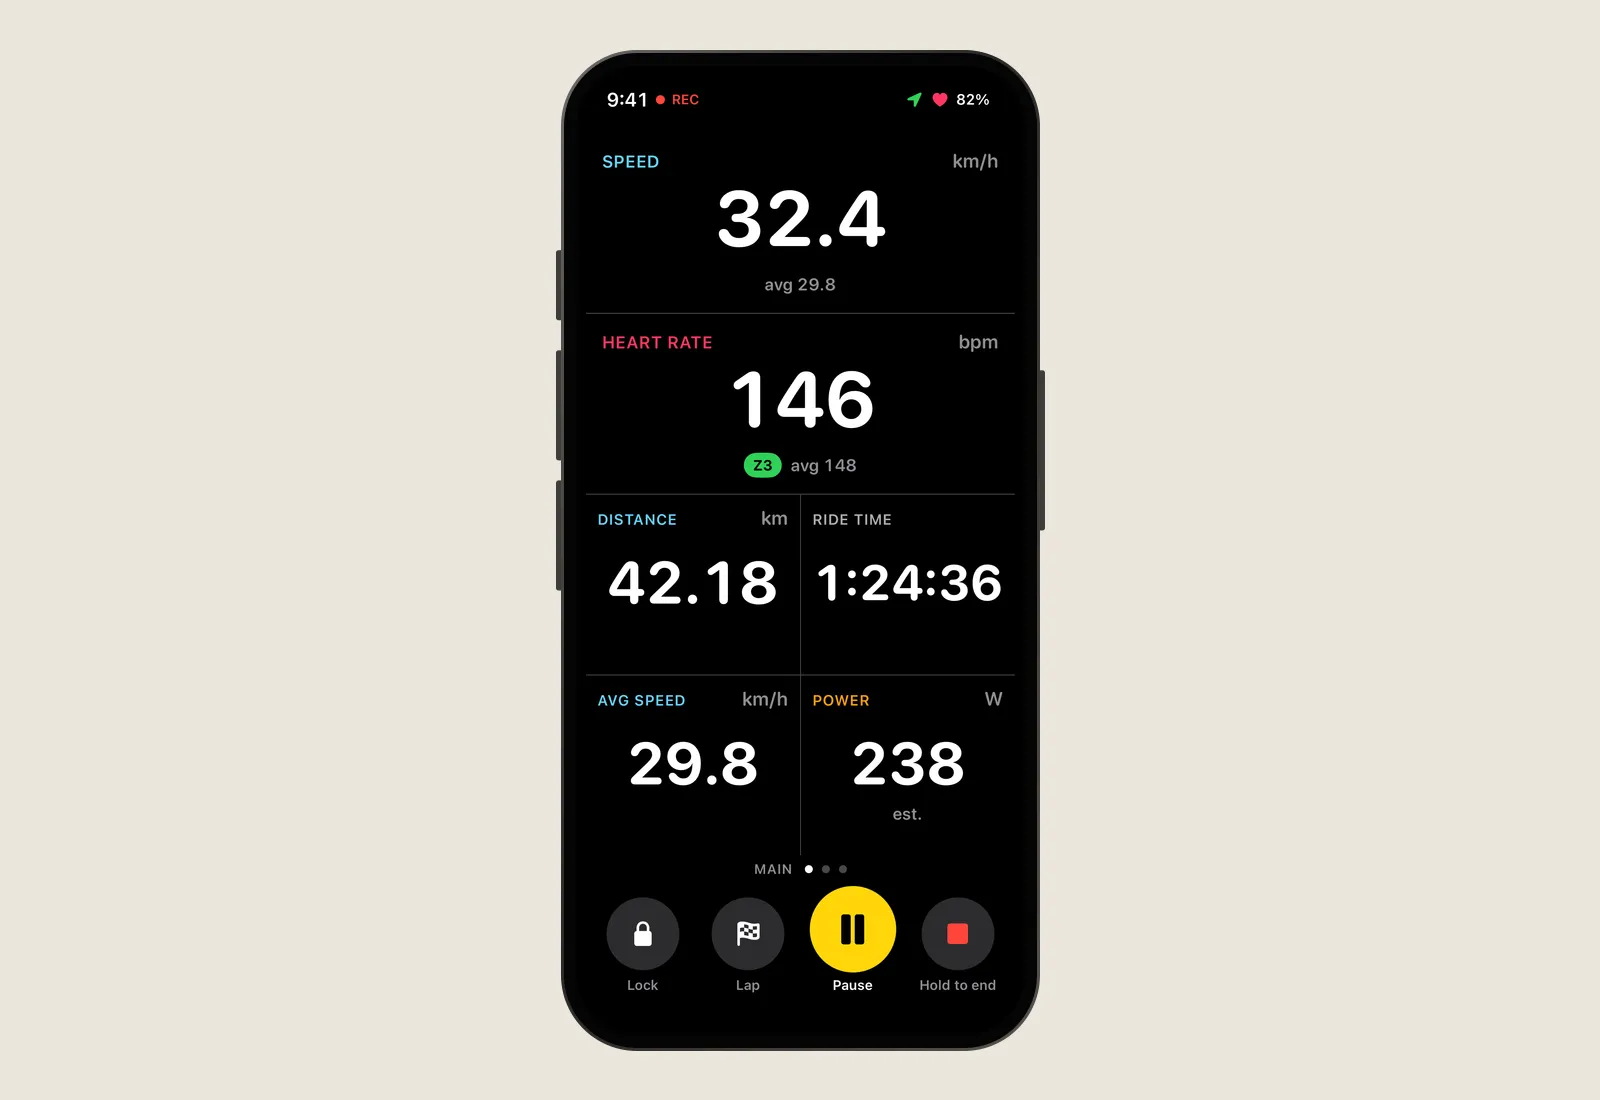
Colour says what kind of number. Speed’s label is blue and heart rate’s is red; the numbers themselves stay white.
One huge number per field. Speed and heart rate get full-width rows; four supporting numbers share a 2 × 2 grid.
Zones carry a number. Zone 3 is green and also says Z3, so it never depends on colour alone.
Estimates say so. Without a power meter, power comes from a physics estimate and is always marked est.
Status across the top. Recording, GPS, heart rate and phone battery.
Your own pages. Swipe between up to five pages of fields you choose.
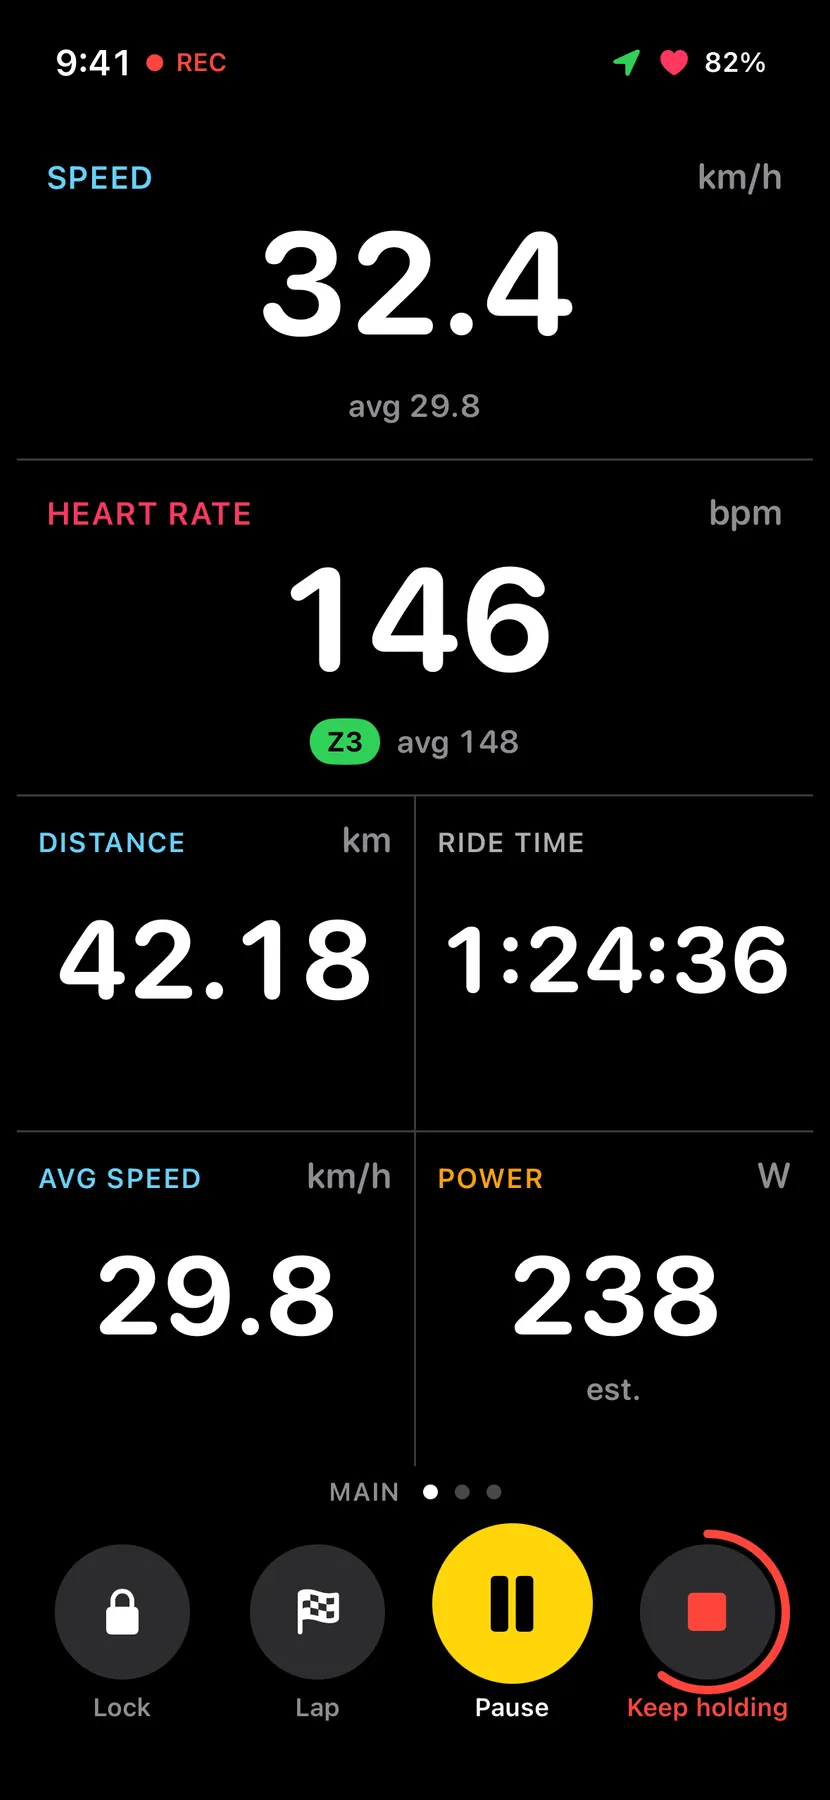
A deliberate end. 64-point buttons for gloves. Ending a ride takes a one-second hold, so a bump can’t end it.
Every state, designed
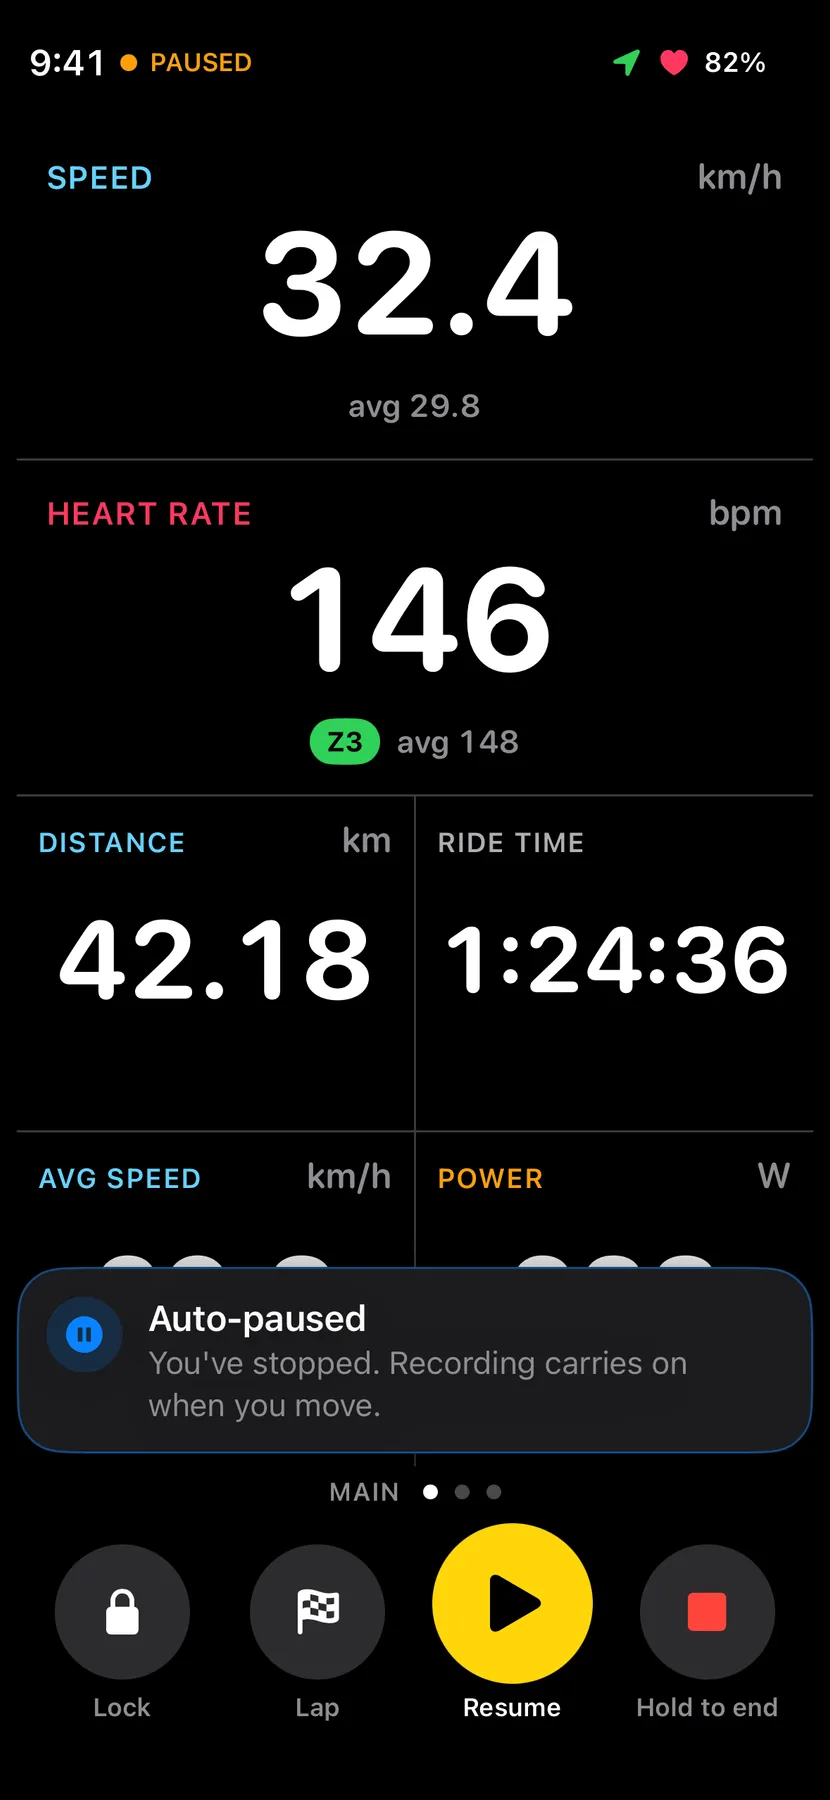
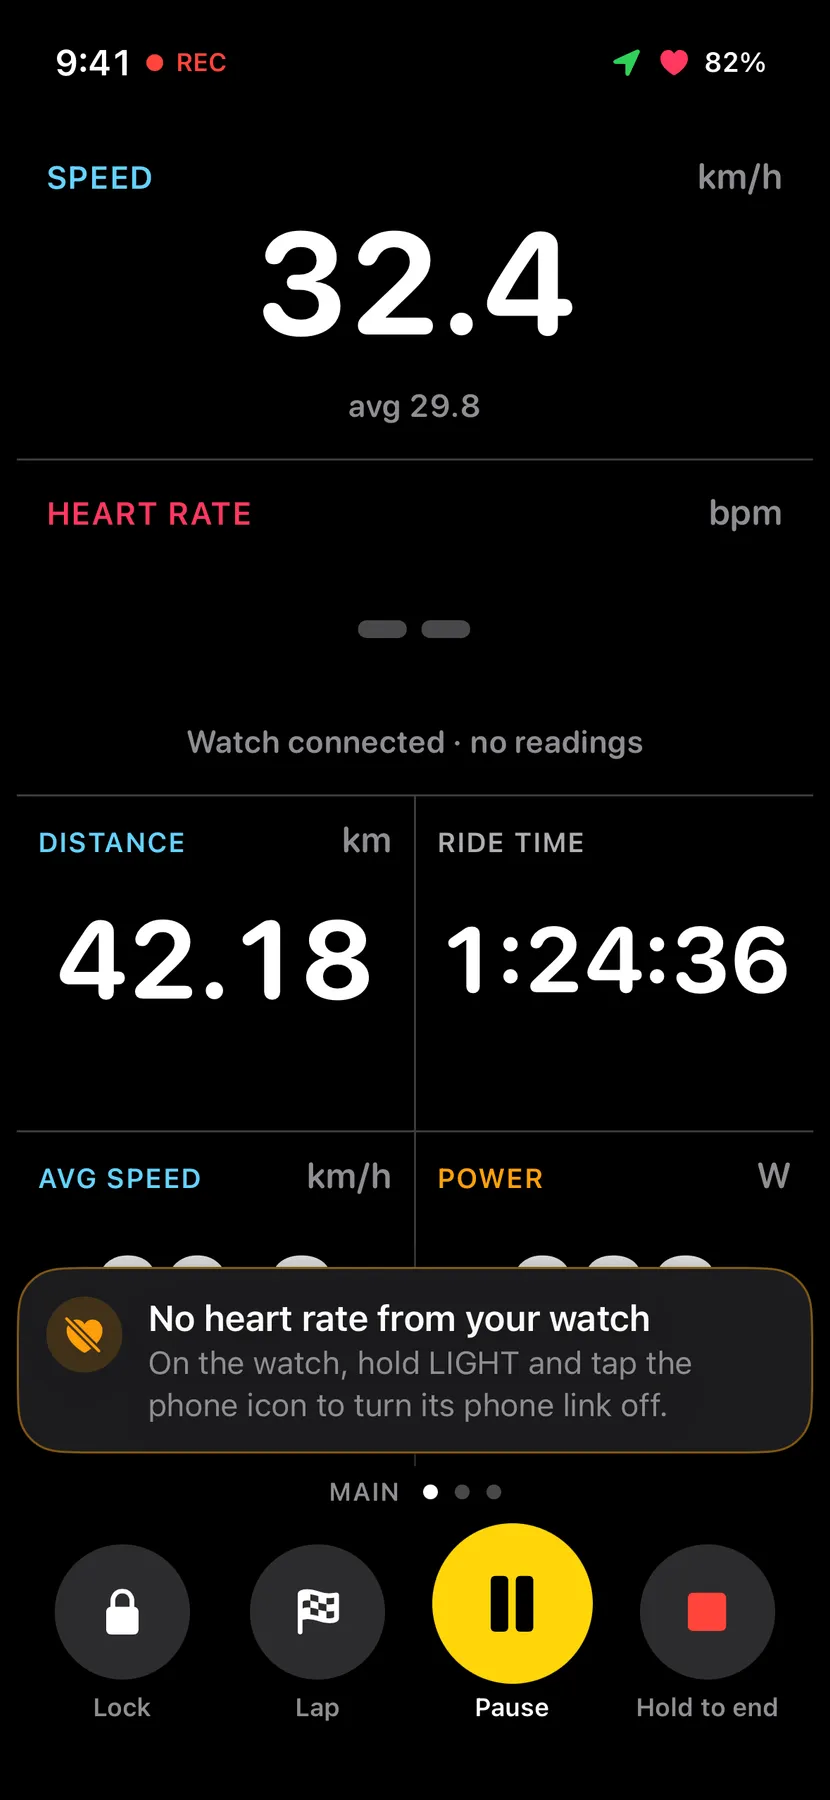
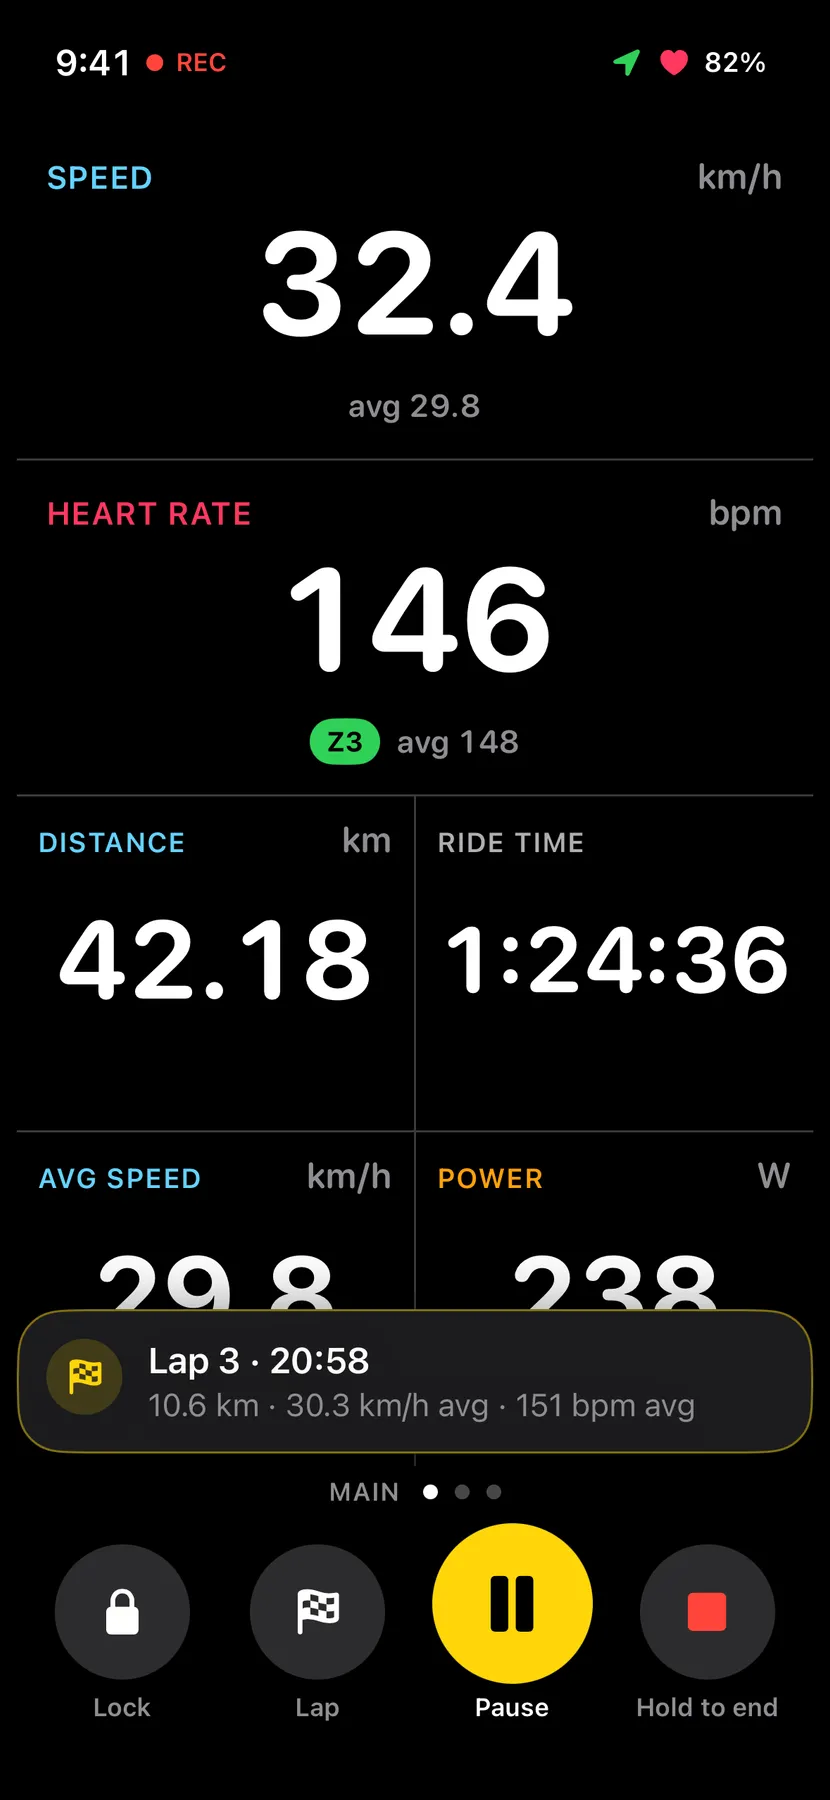
Pausing, locking the screen, losing heart rate, finishing a lap and ending a ride each have their own clear state. The data stays visible behind every message.
- (open larger image)
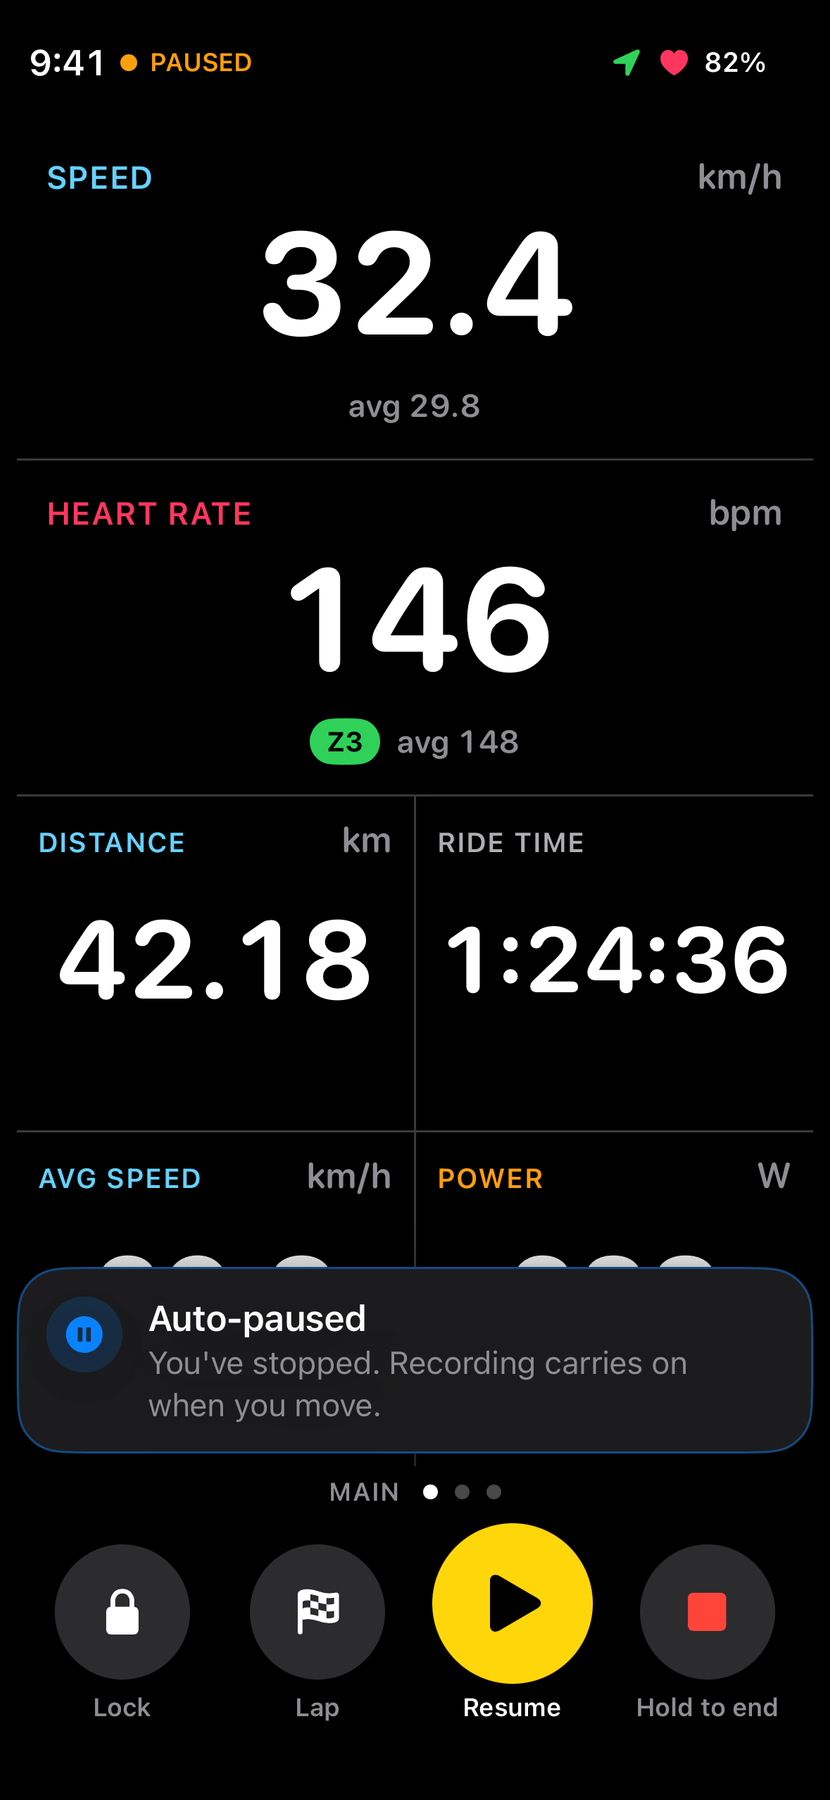
Auto-paused: Pause becomes Resume, and speed and heart rate stay in view. - (open larger image)
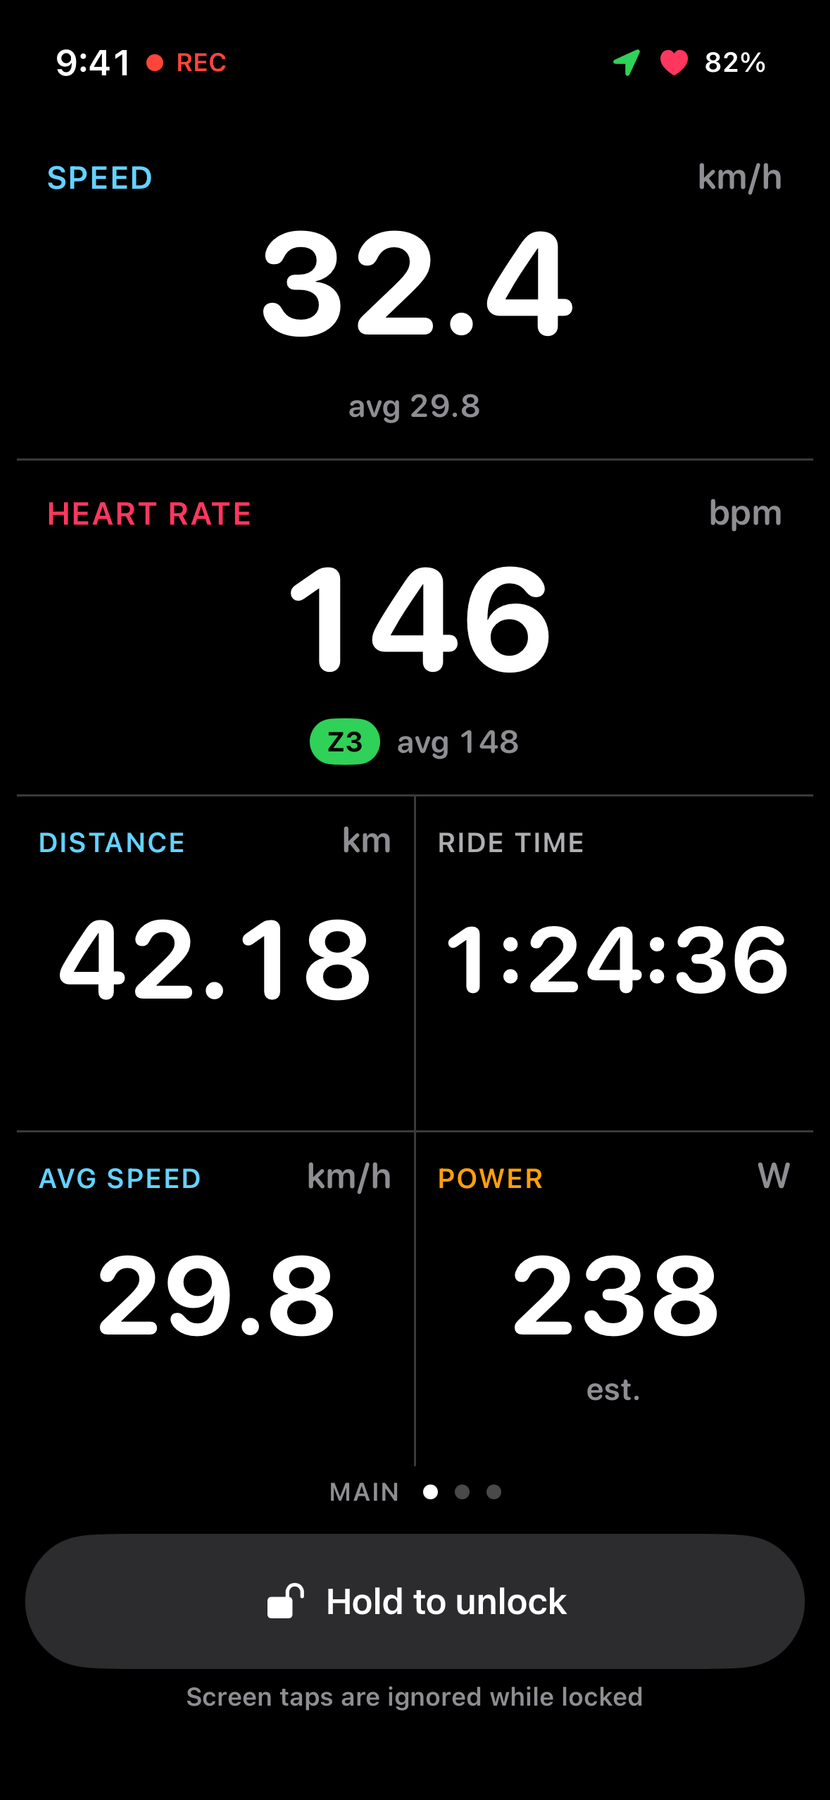
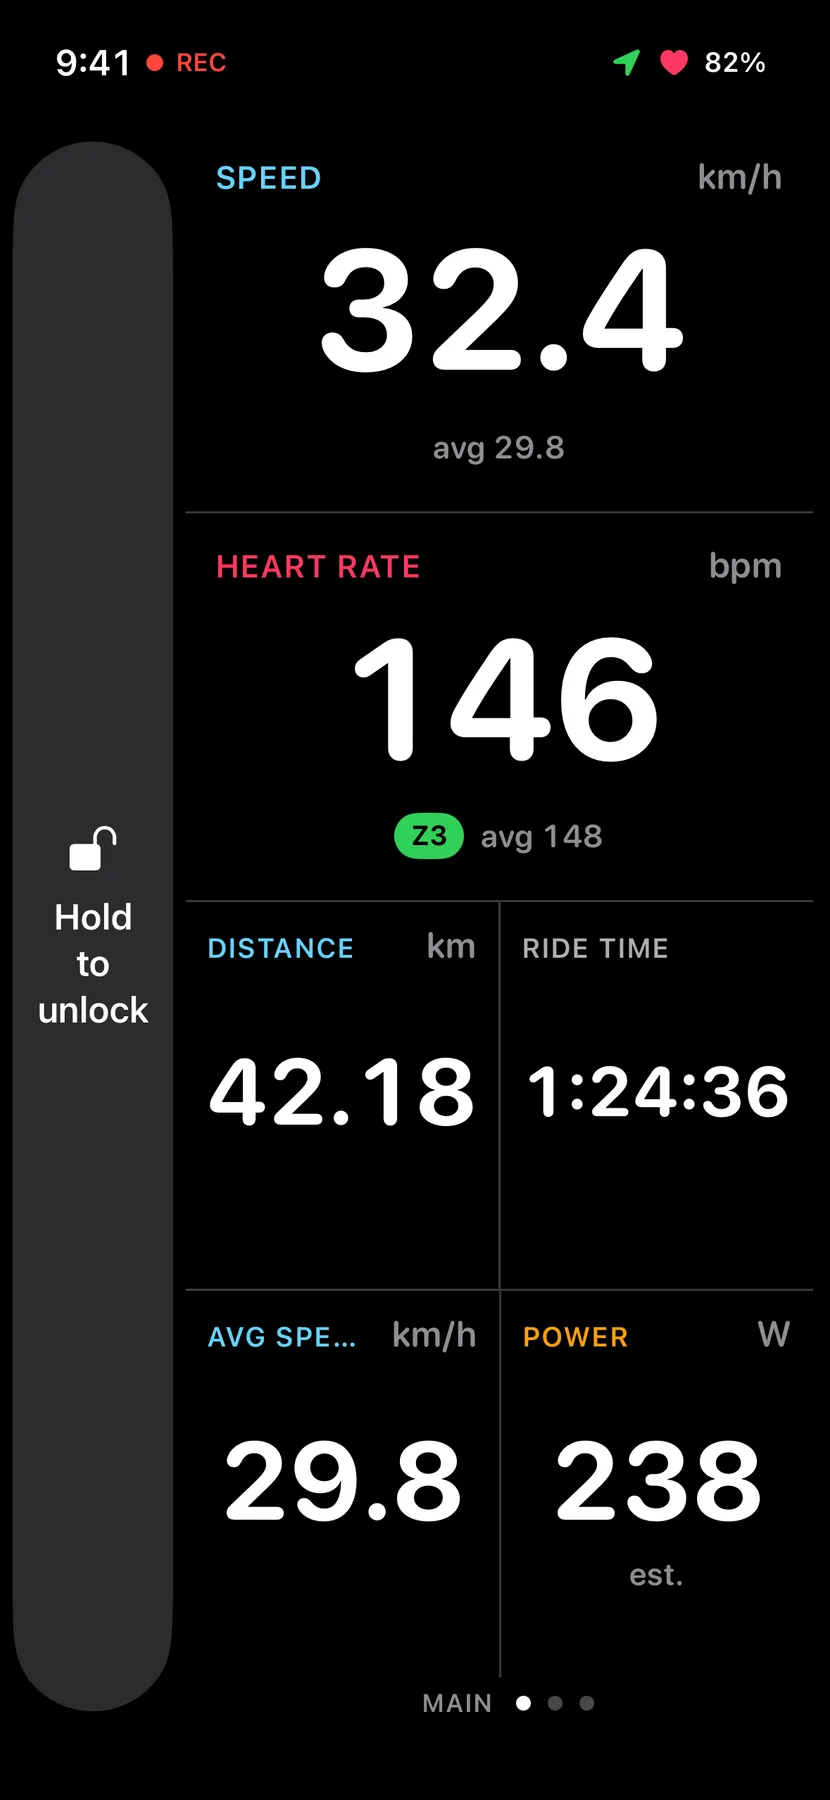
Locked: one hold-to-unlock bar, so rain and pocket taps do nothing. - (open larger image)
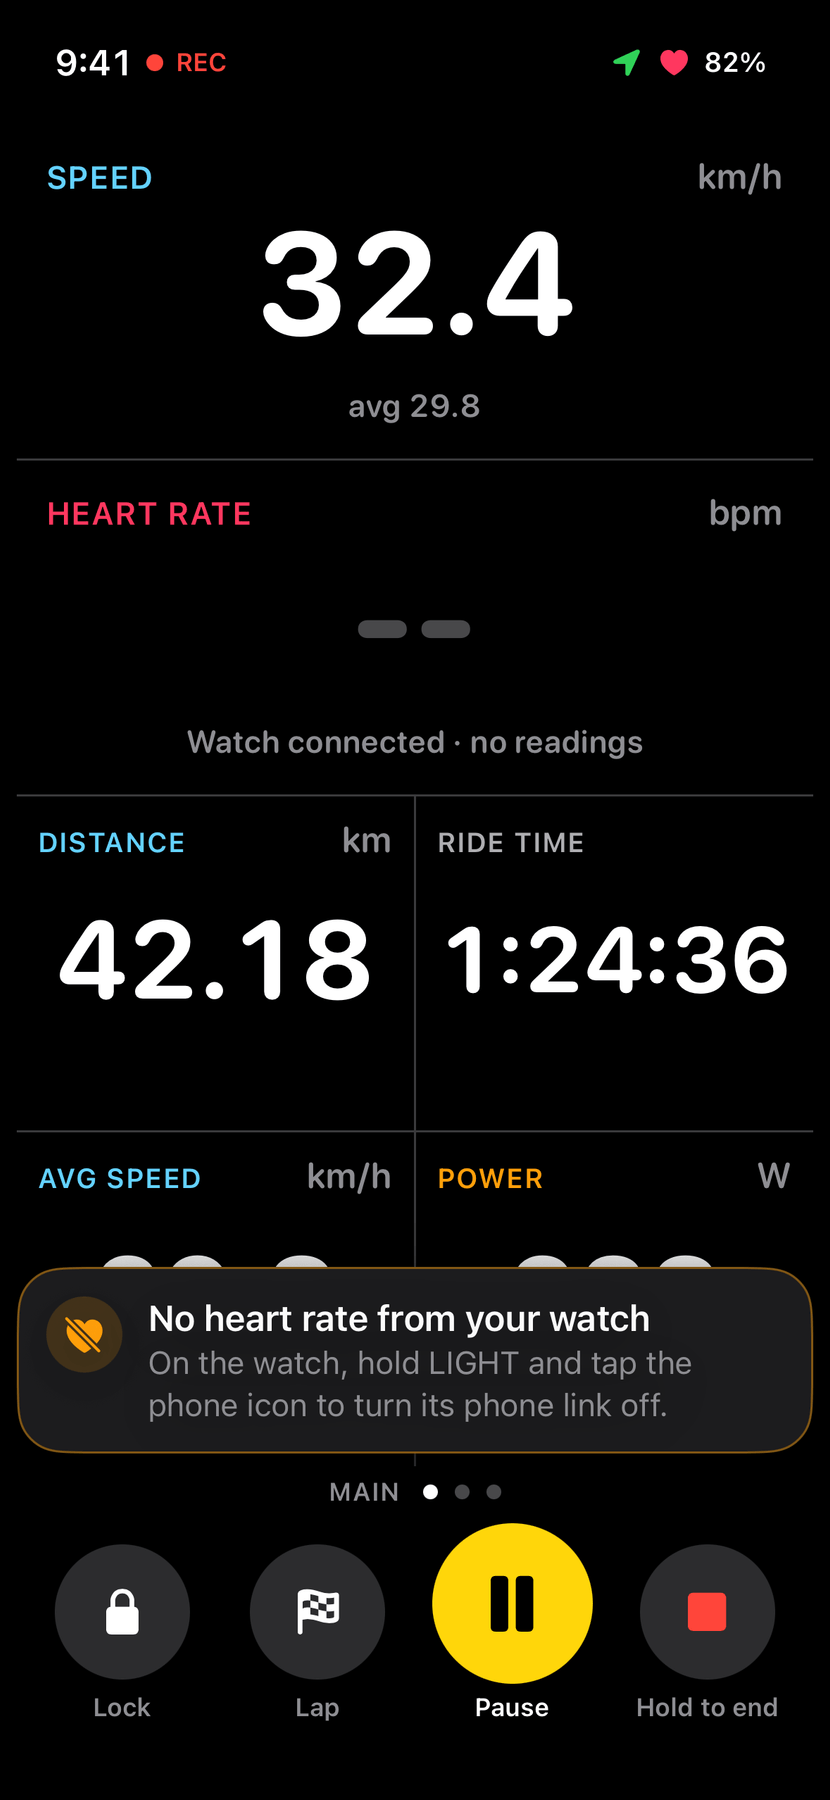
No heart rate: dashes rather than a guess, and the fix that Phase 1 testing found. - (open larger image)
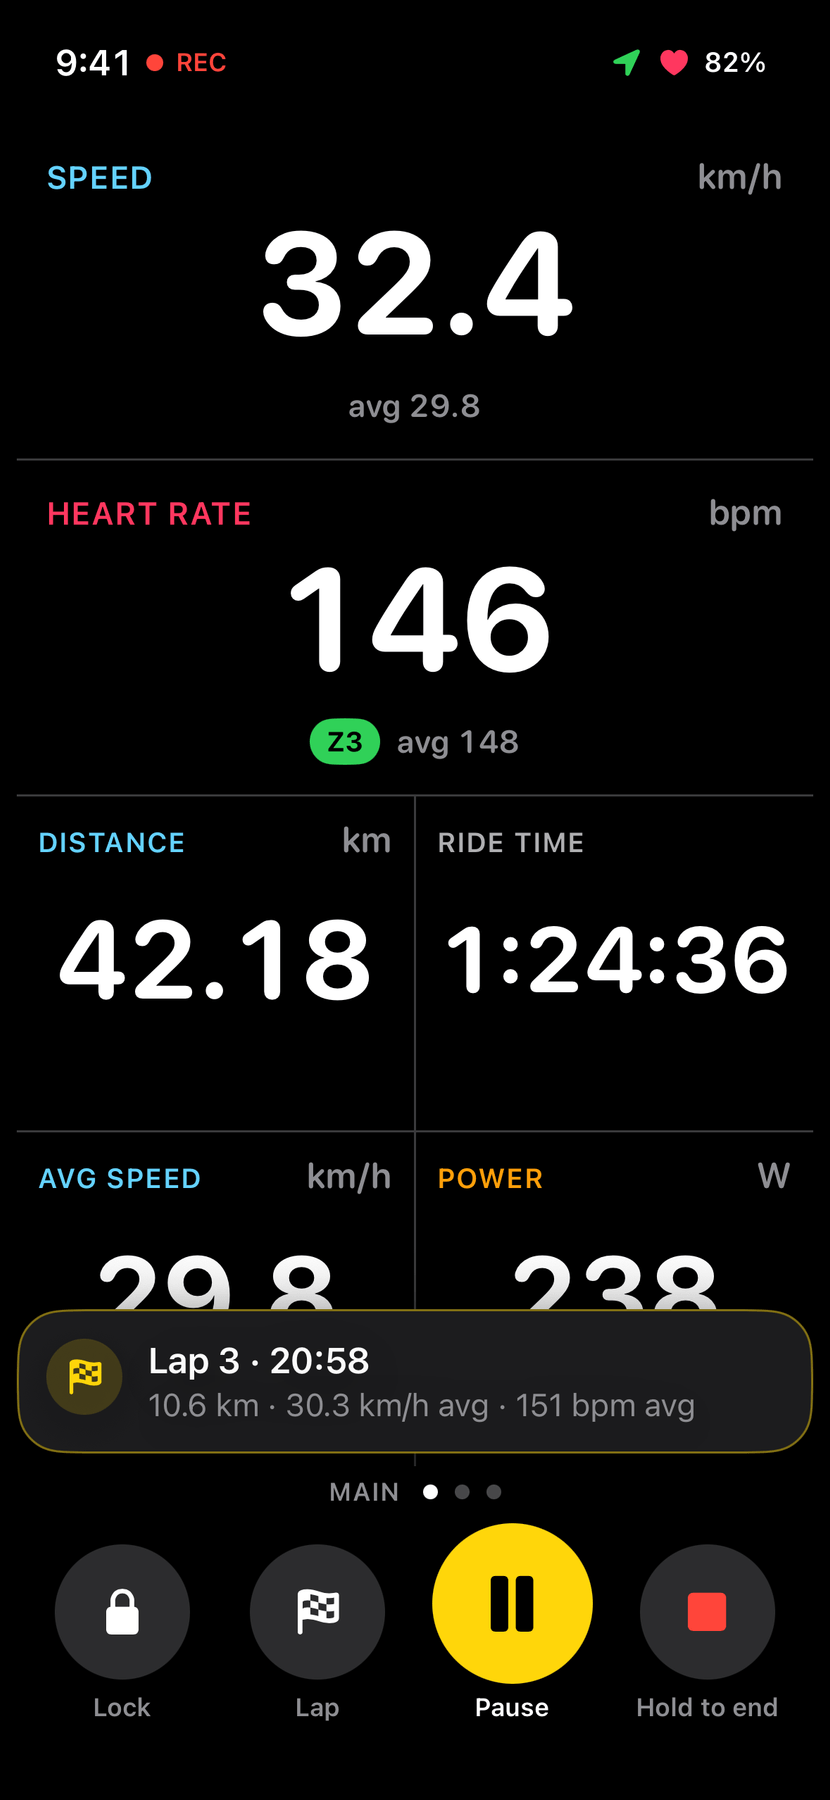
A lap: the one you just finished, for five seconds. - (open larger image)
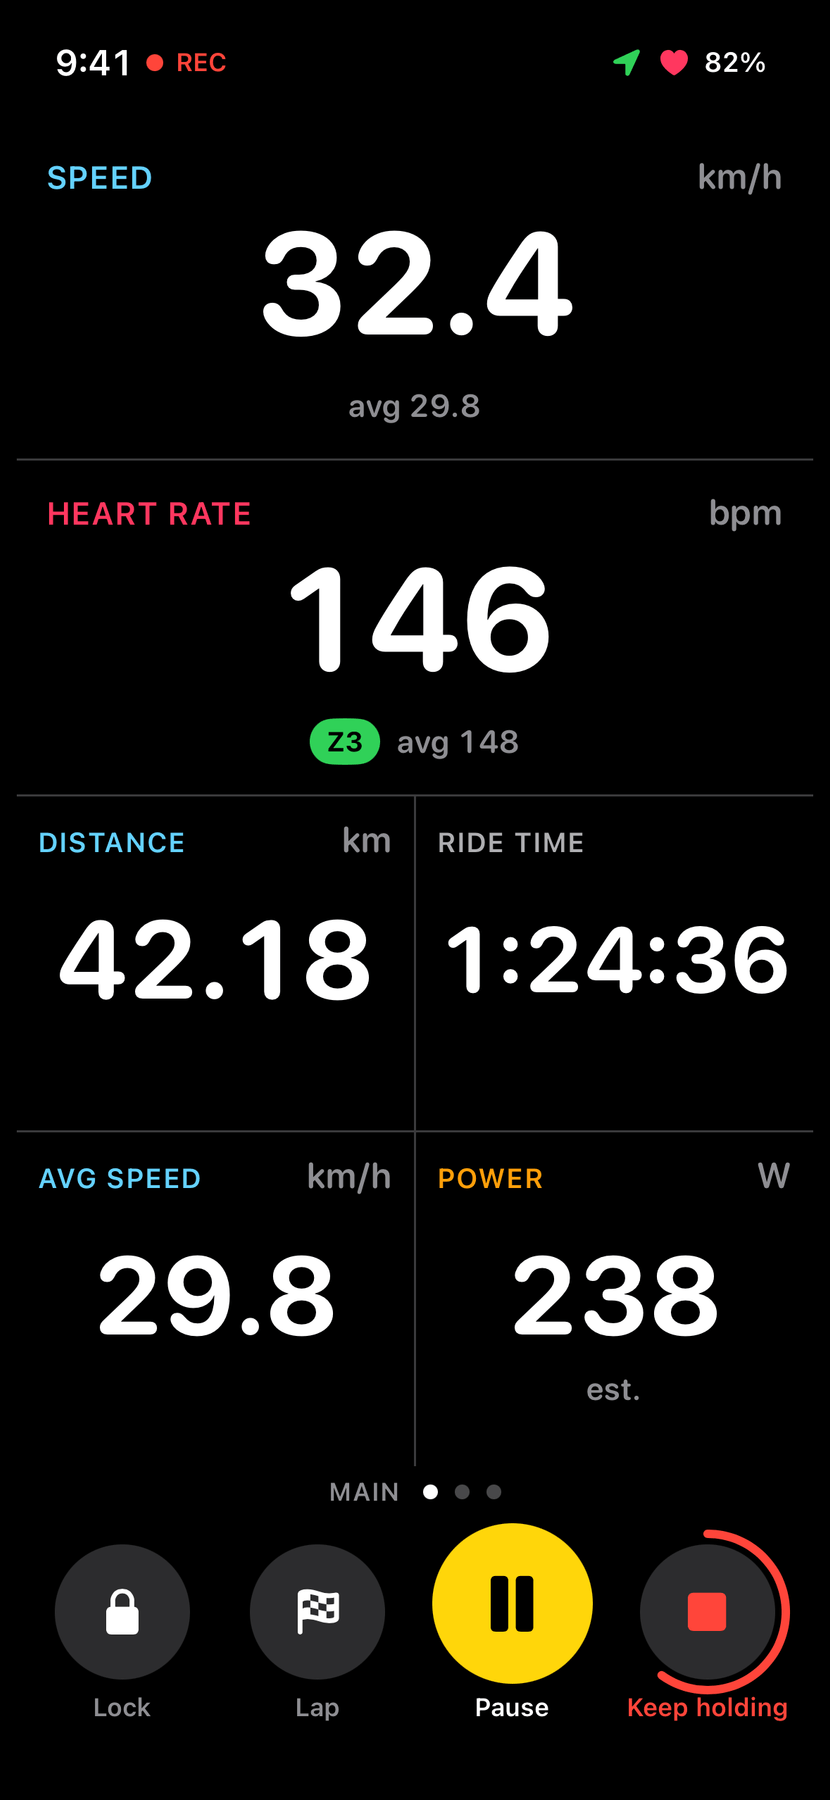
Ending: a ring fills over one second. Let go to cancel.
Pages you set up yourself
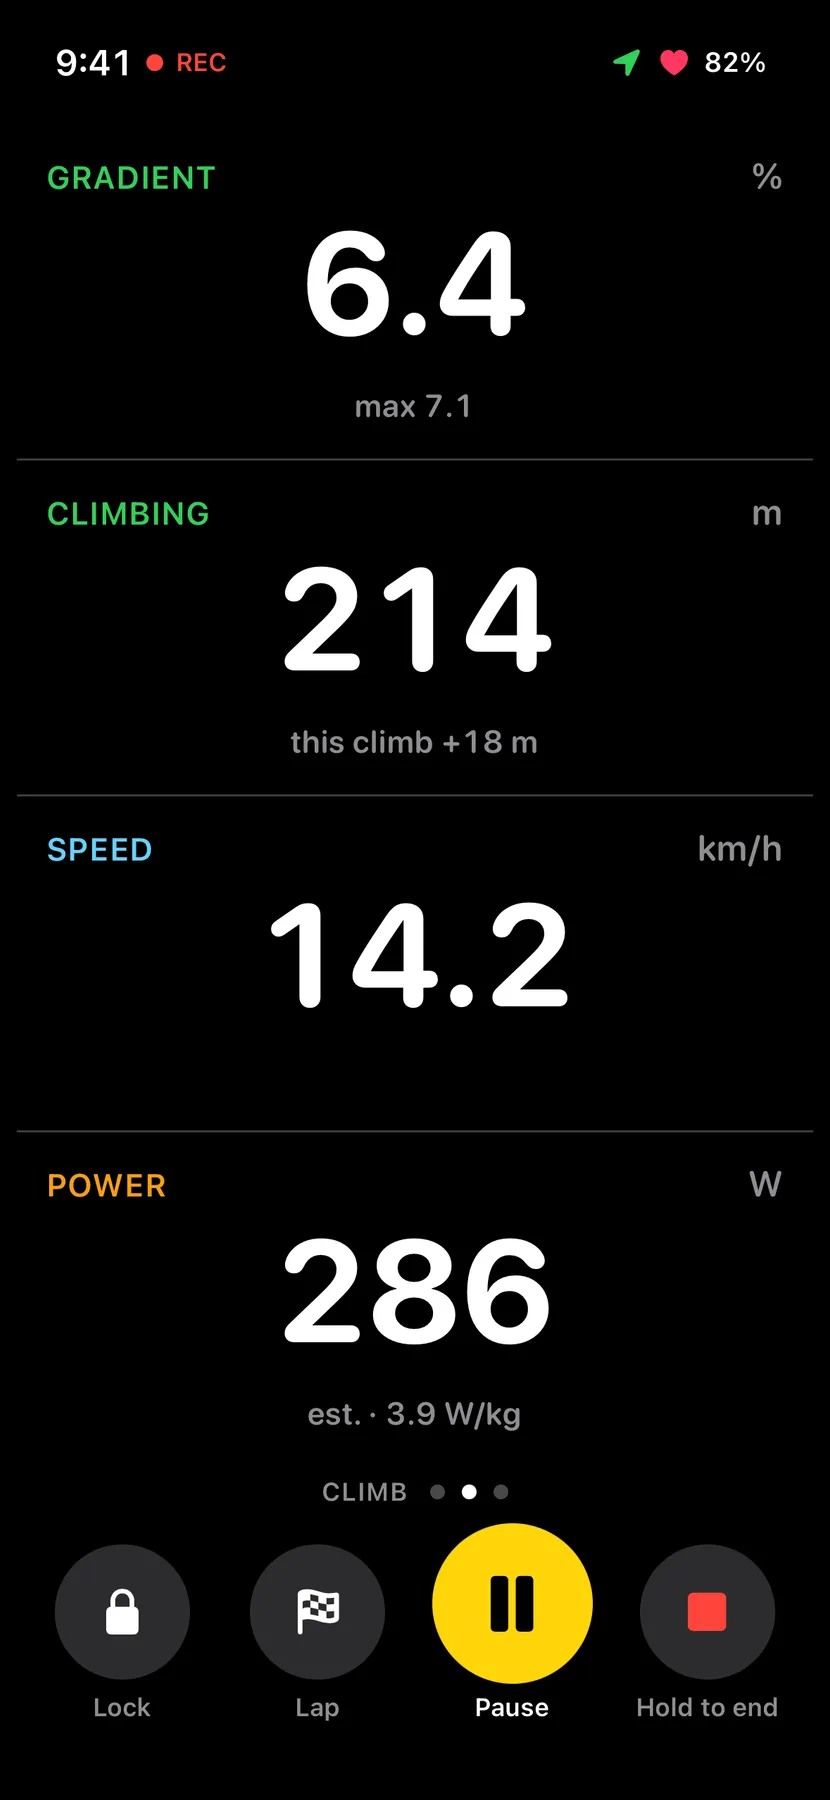
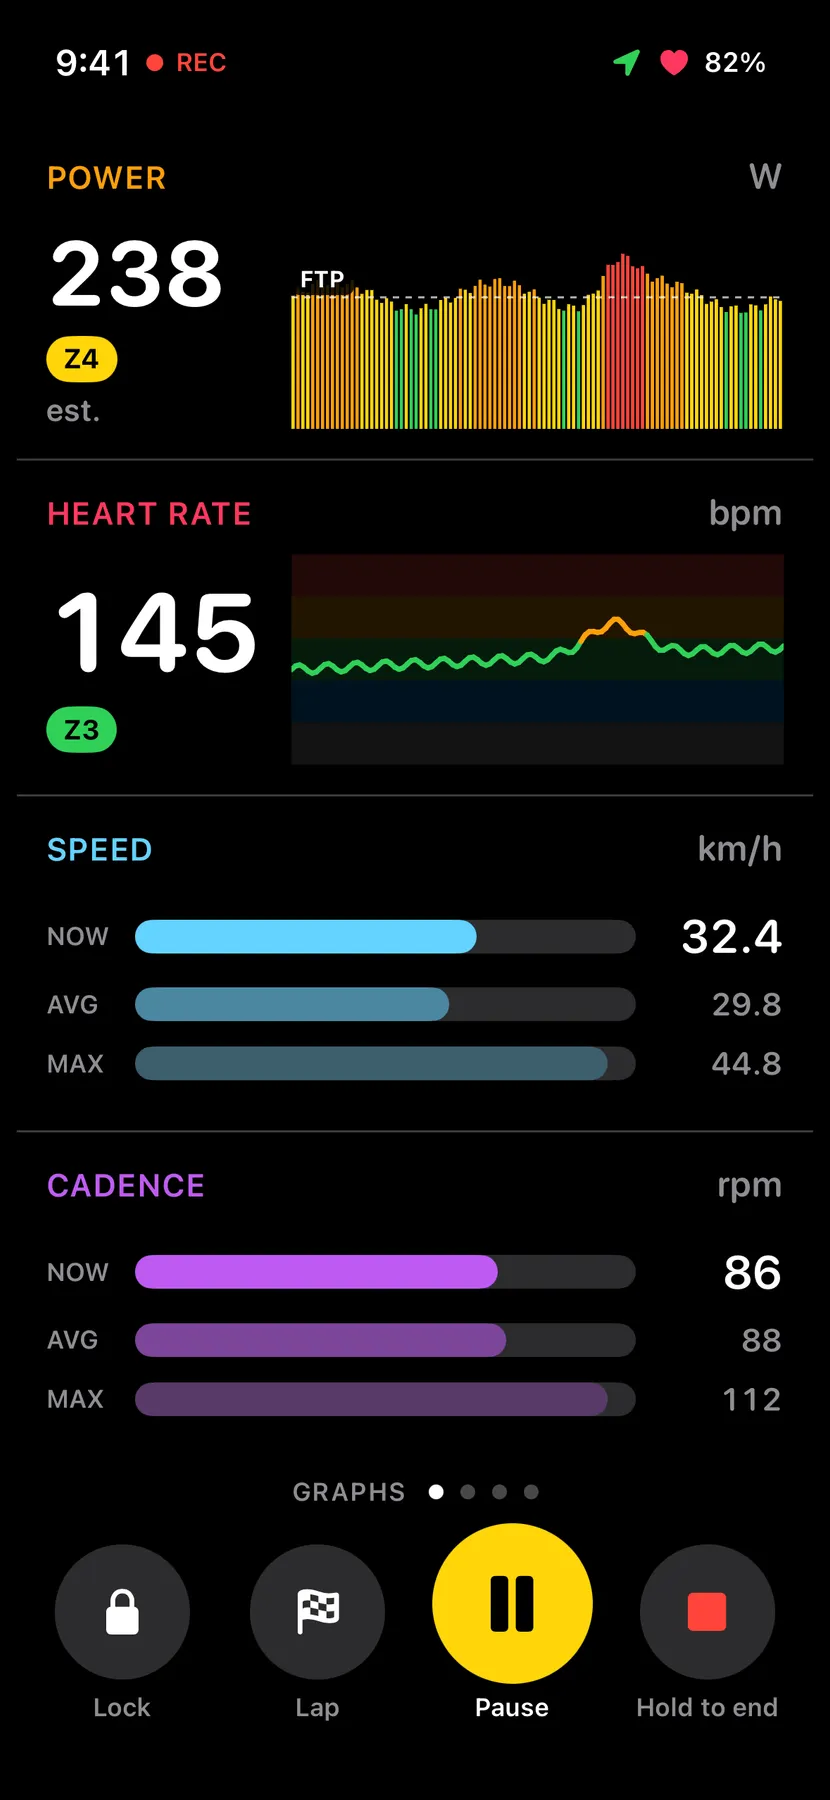
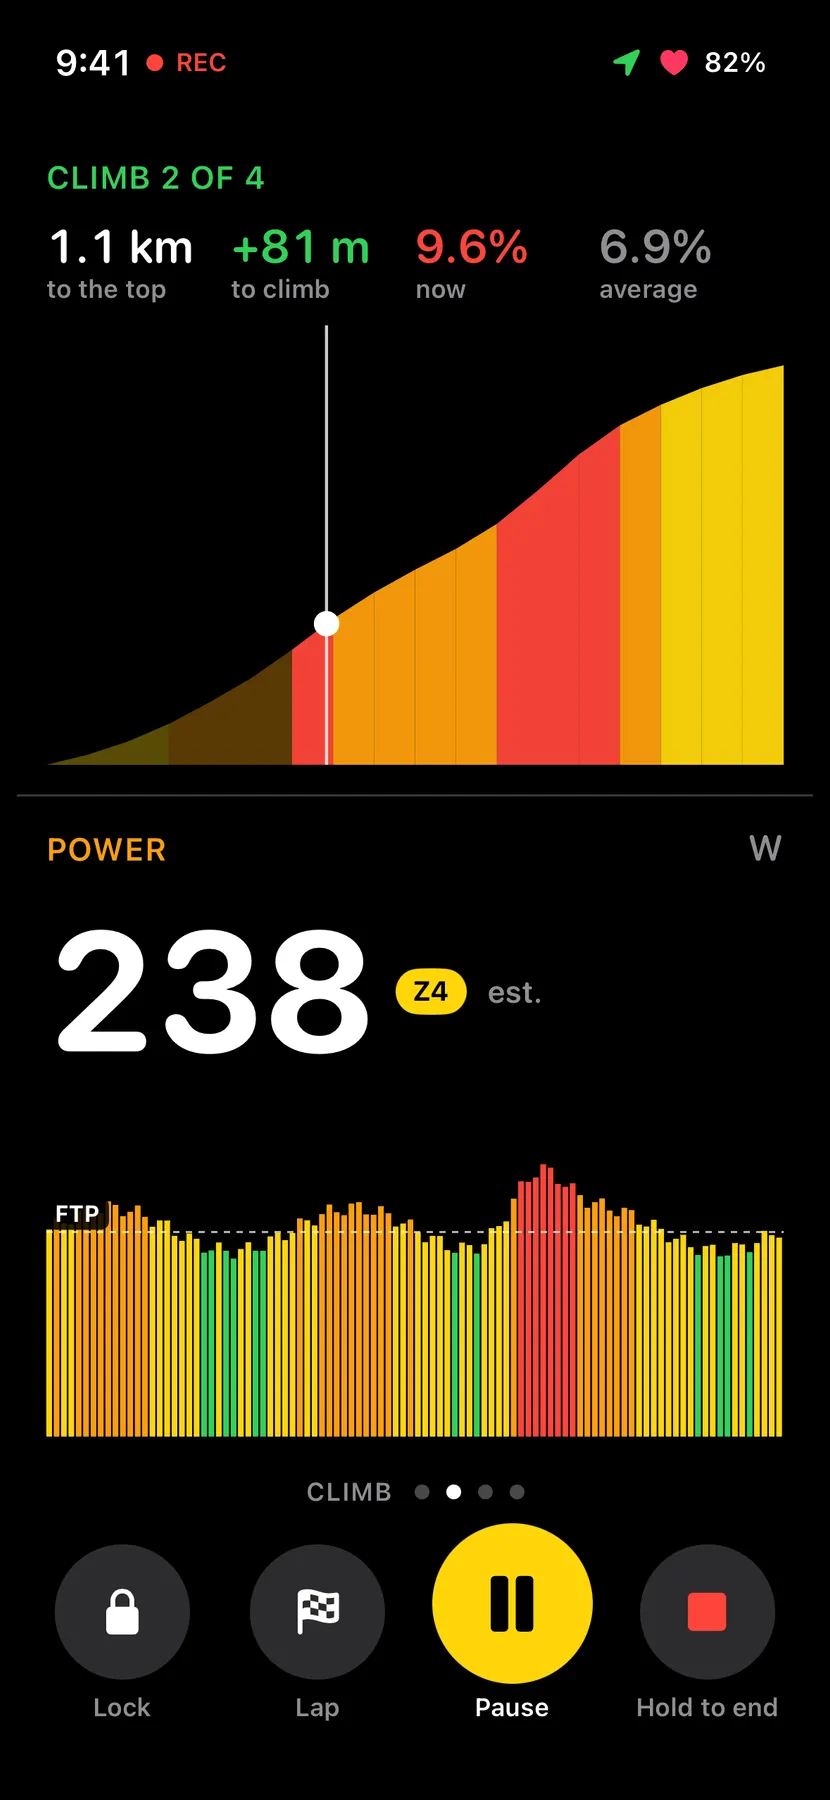
Any field can go in any slot, on up to five pages. At the design review I asked for Garmin-style graph fields, so graphs sit alongside the plain numbers: a power graph coloured by training zone, a heart-rate graph over zone bands, bars for now, average and max, and a profile of the climb ahead.
- (open larger image)
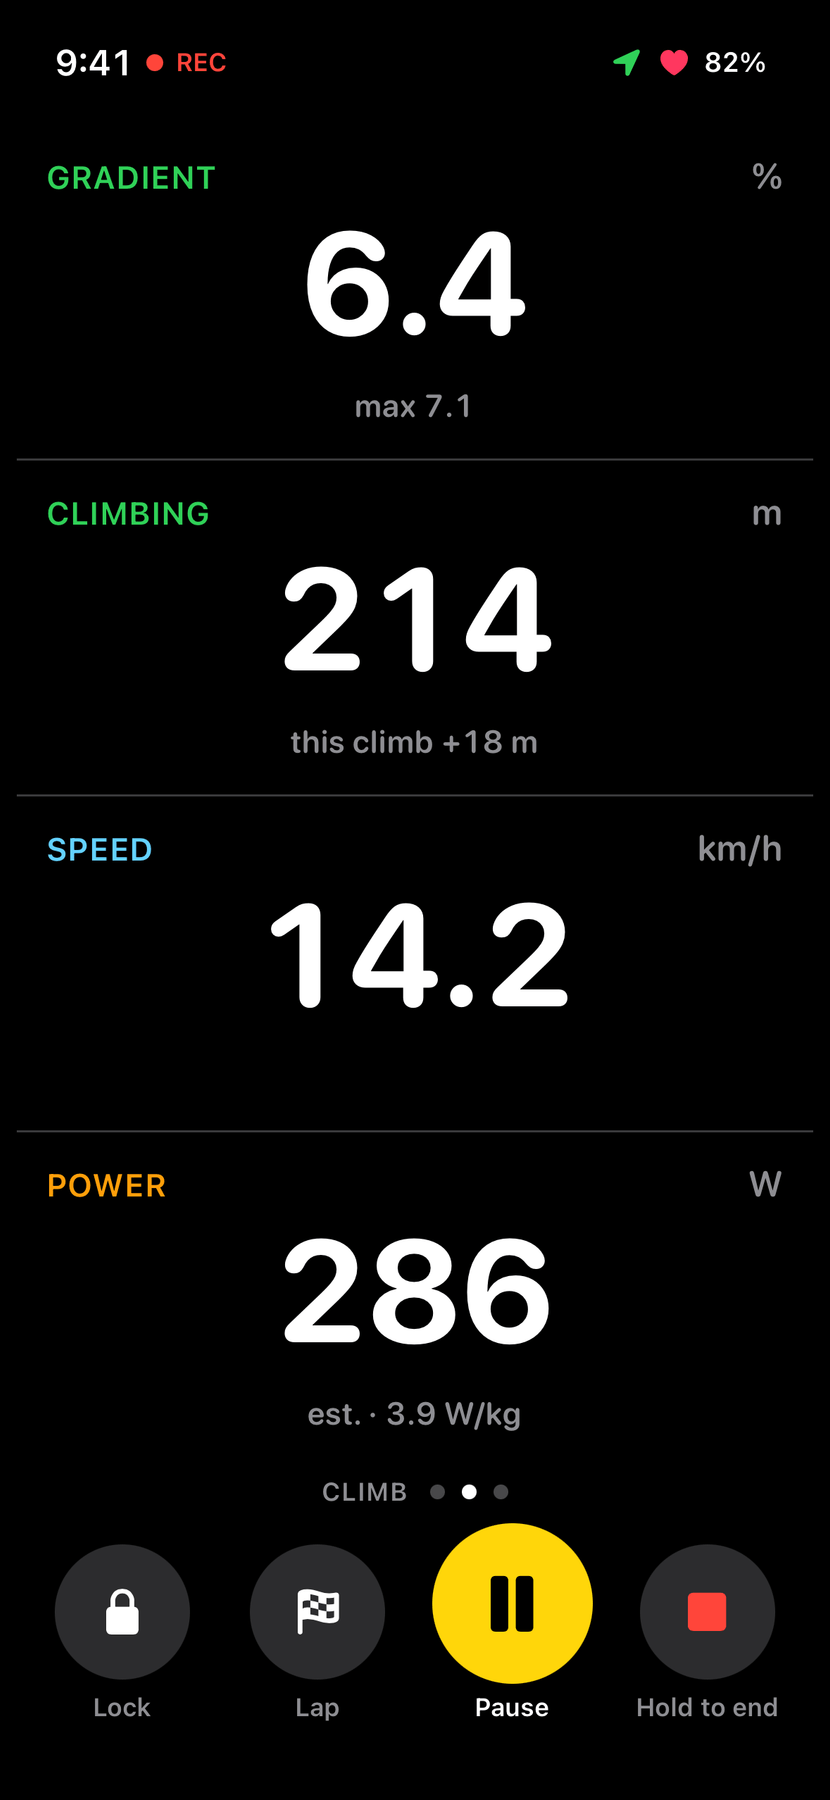
A Climb page: four full-width rows. - (open larger image)
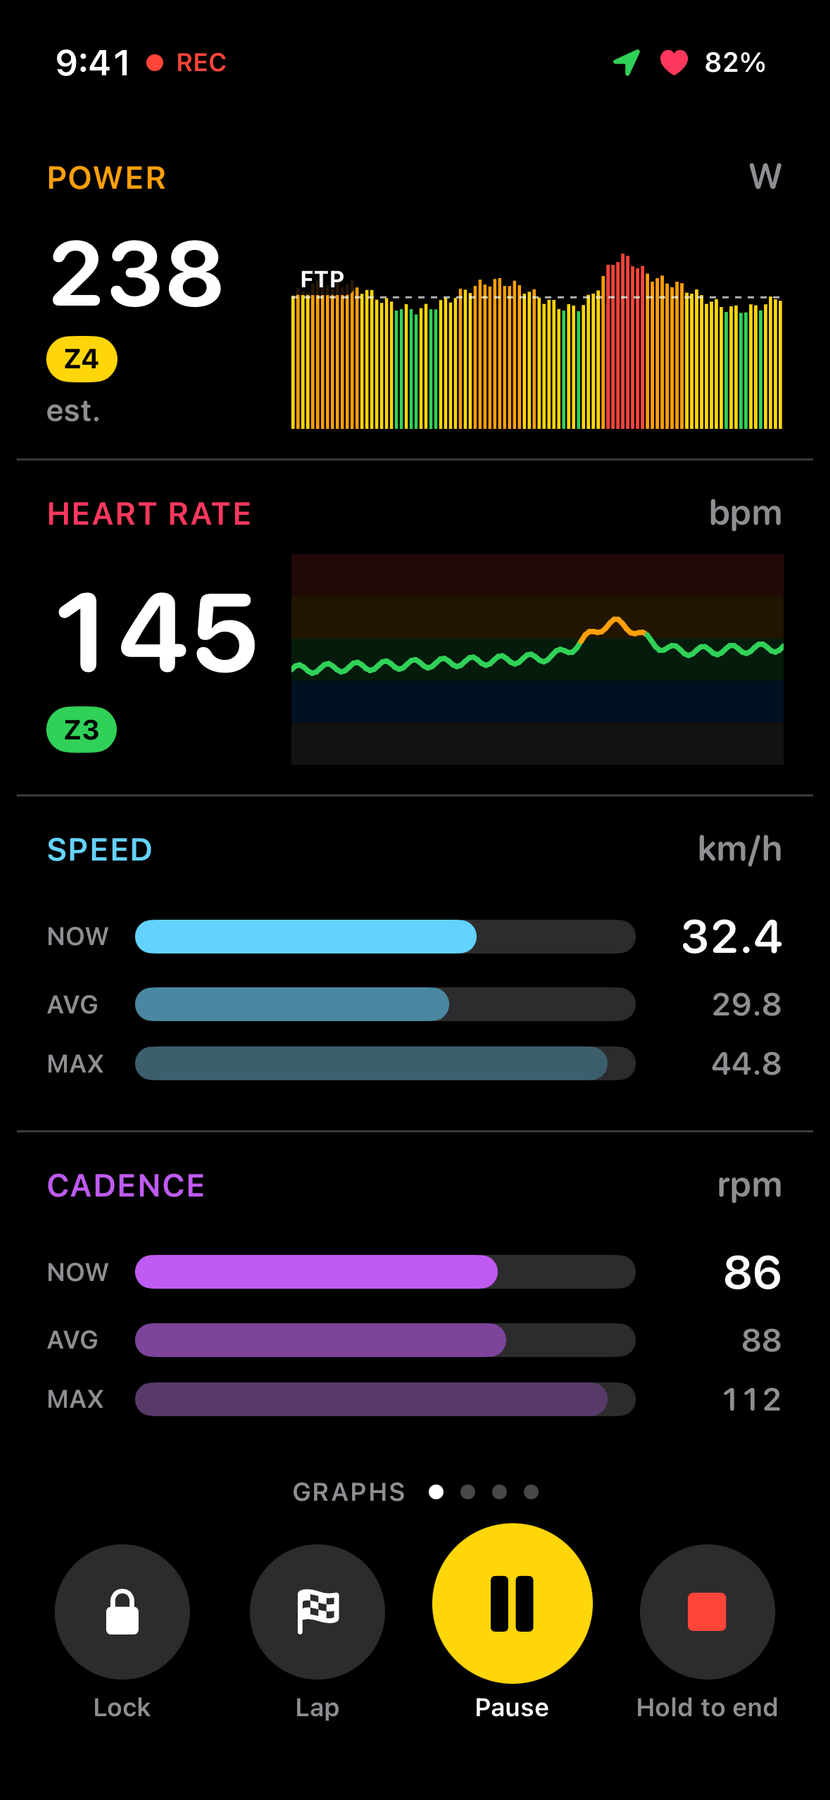
Graphs: power by zone, heart rate, speed and cadence bars. - (open larger image)
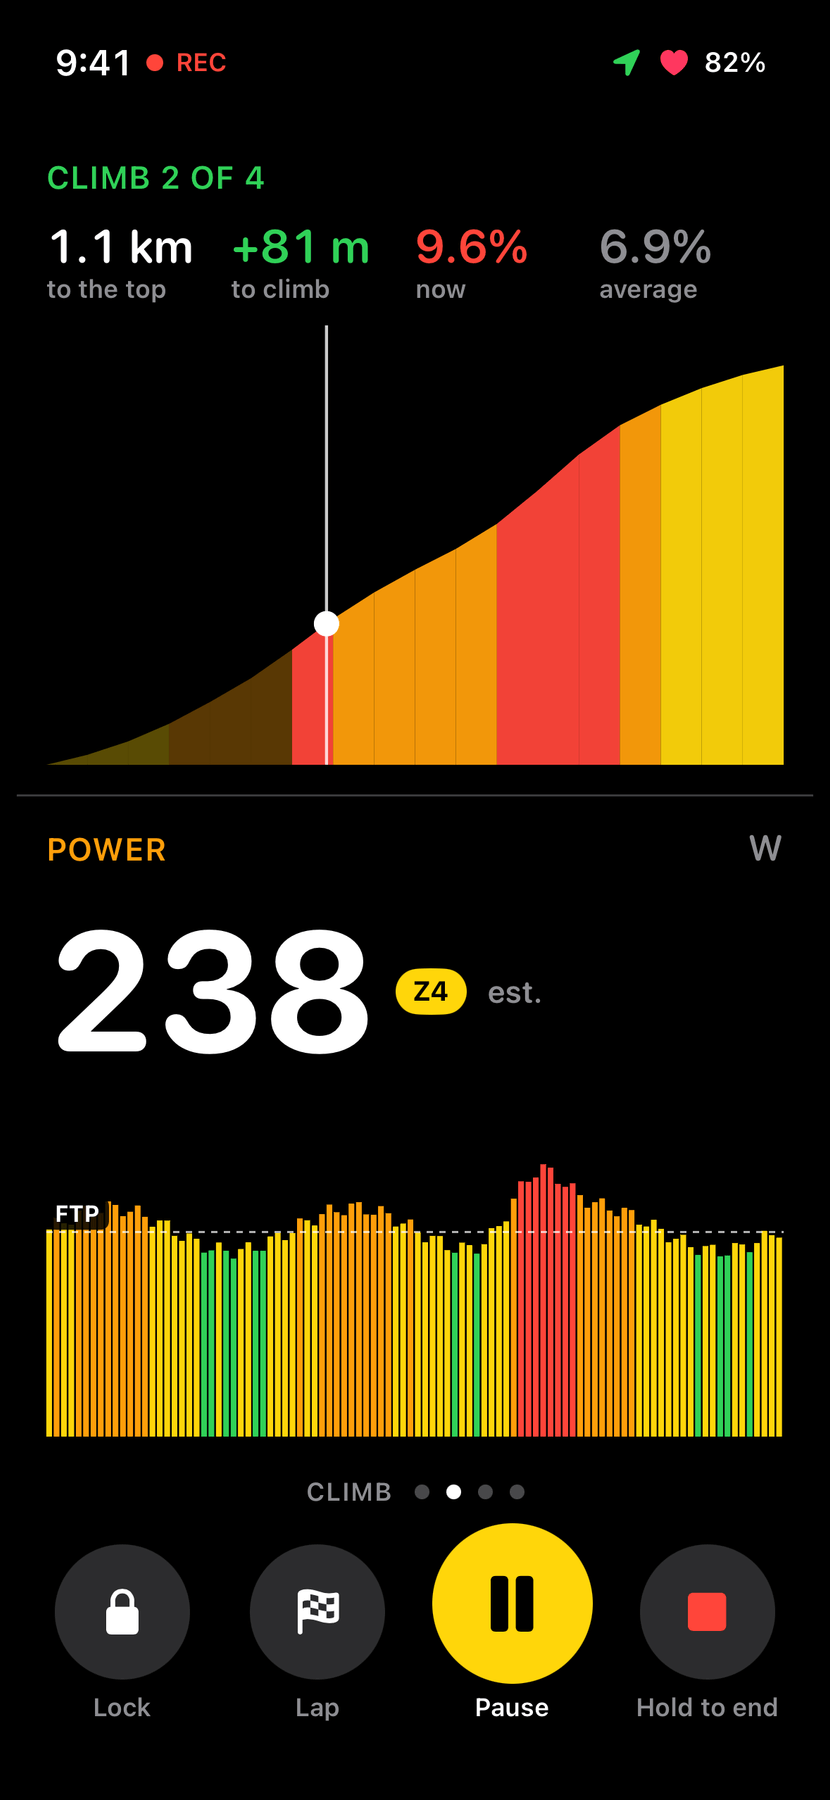
The climb ahead, coloured by steepness. It needs a route. - (open larger image)
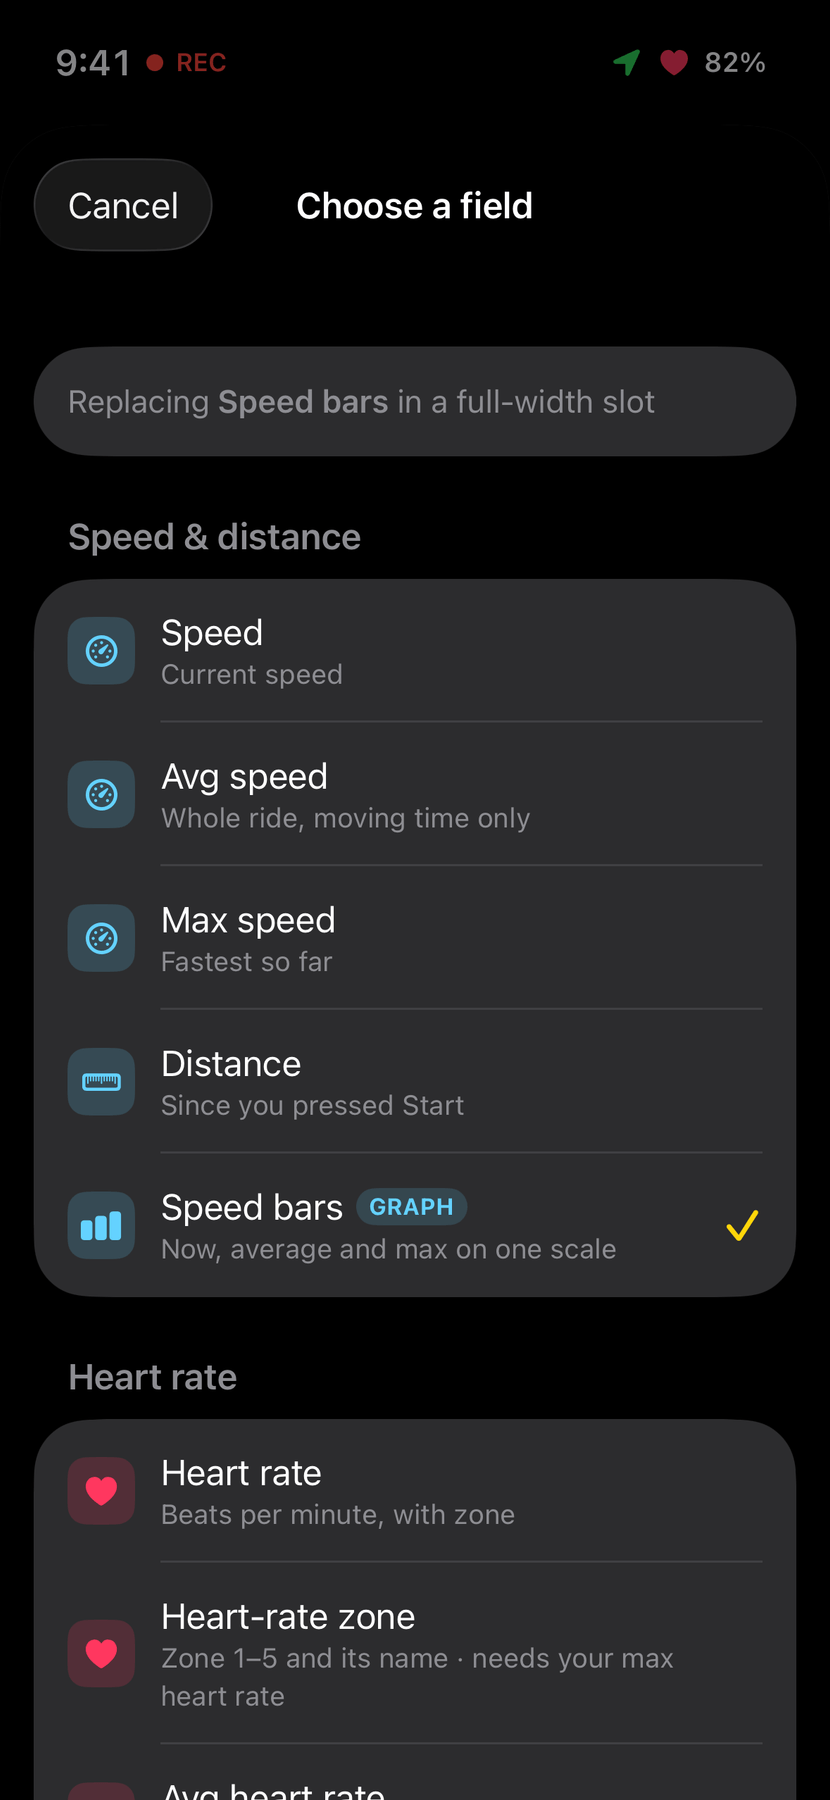
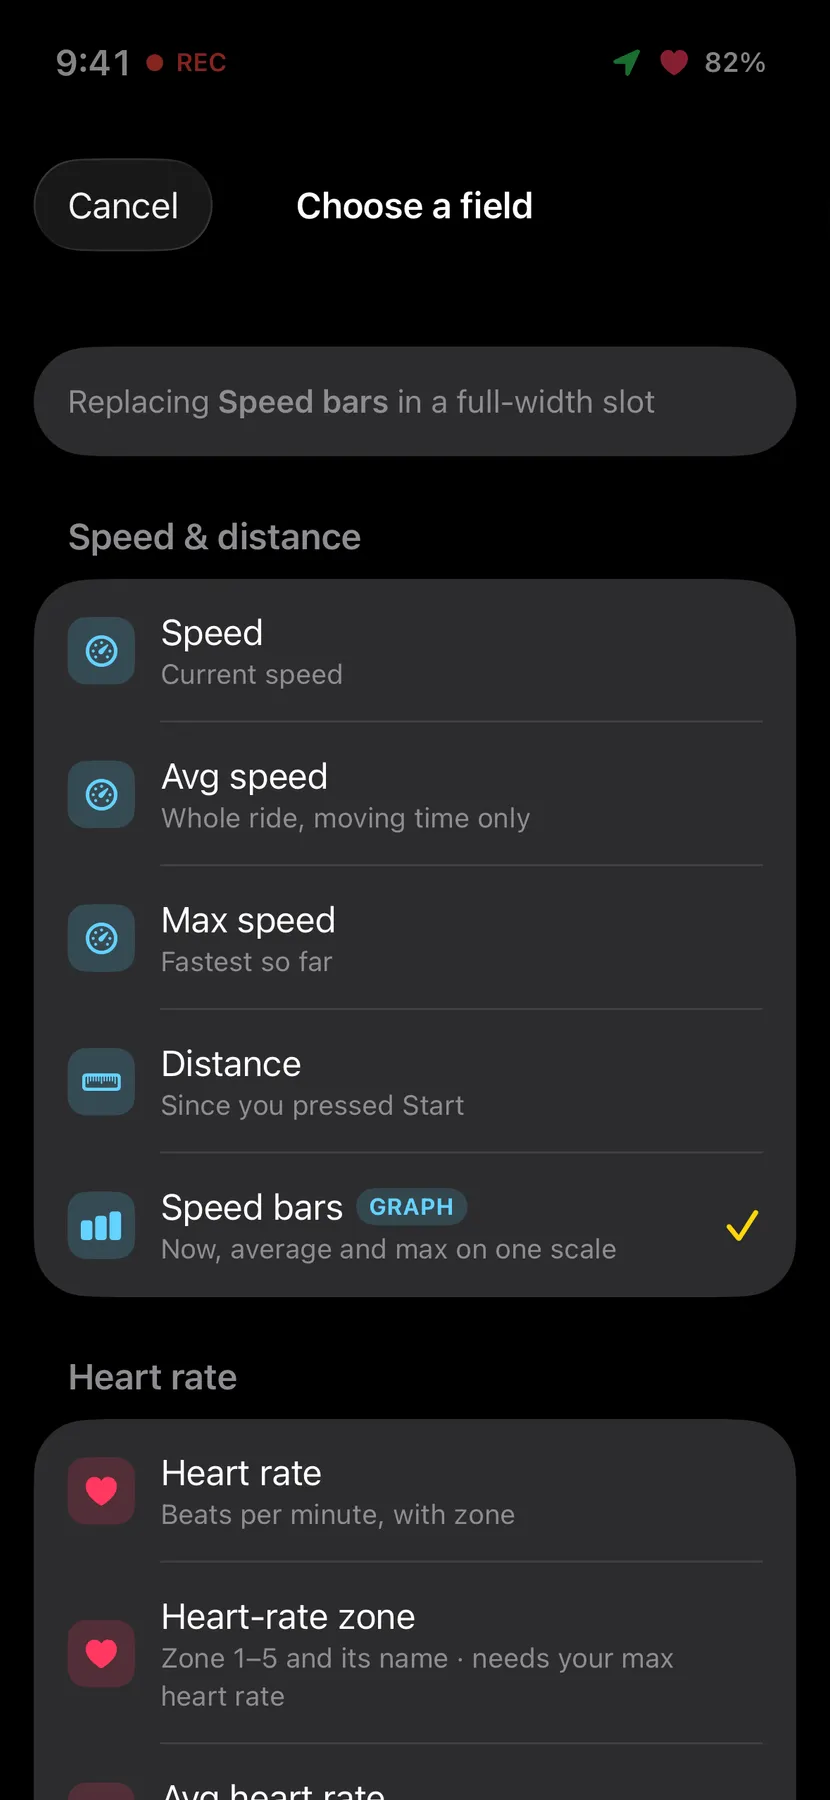
Press and hold any field to change it, even mid-ride.
Buttons where your thumbs are
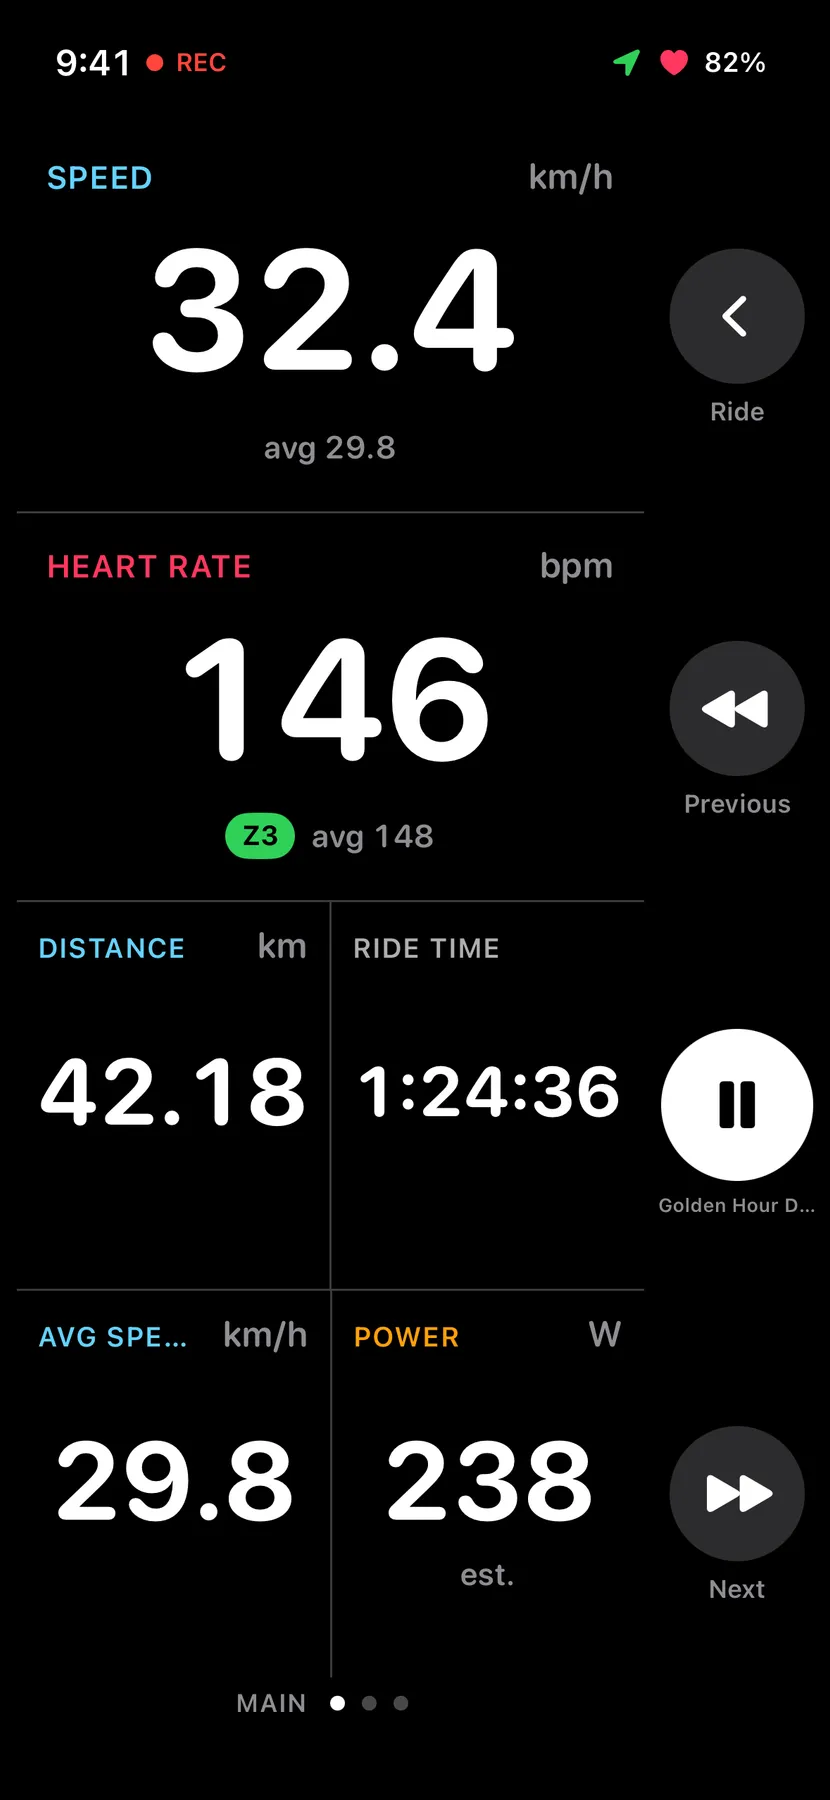
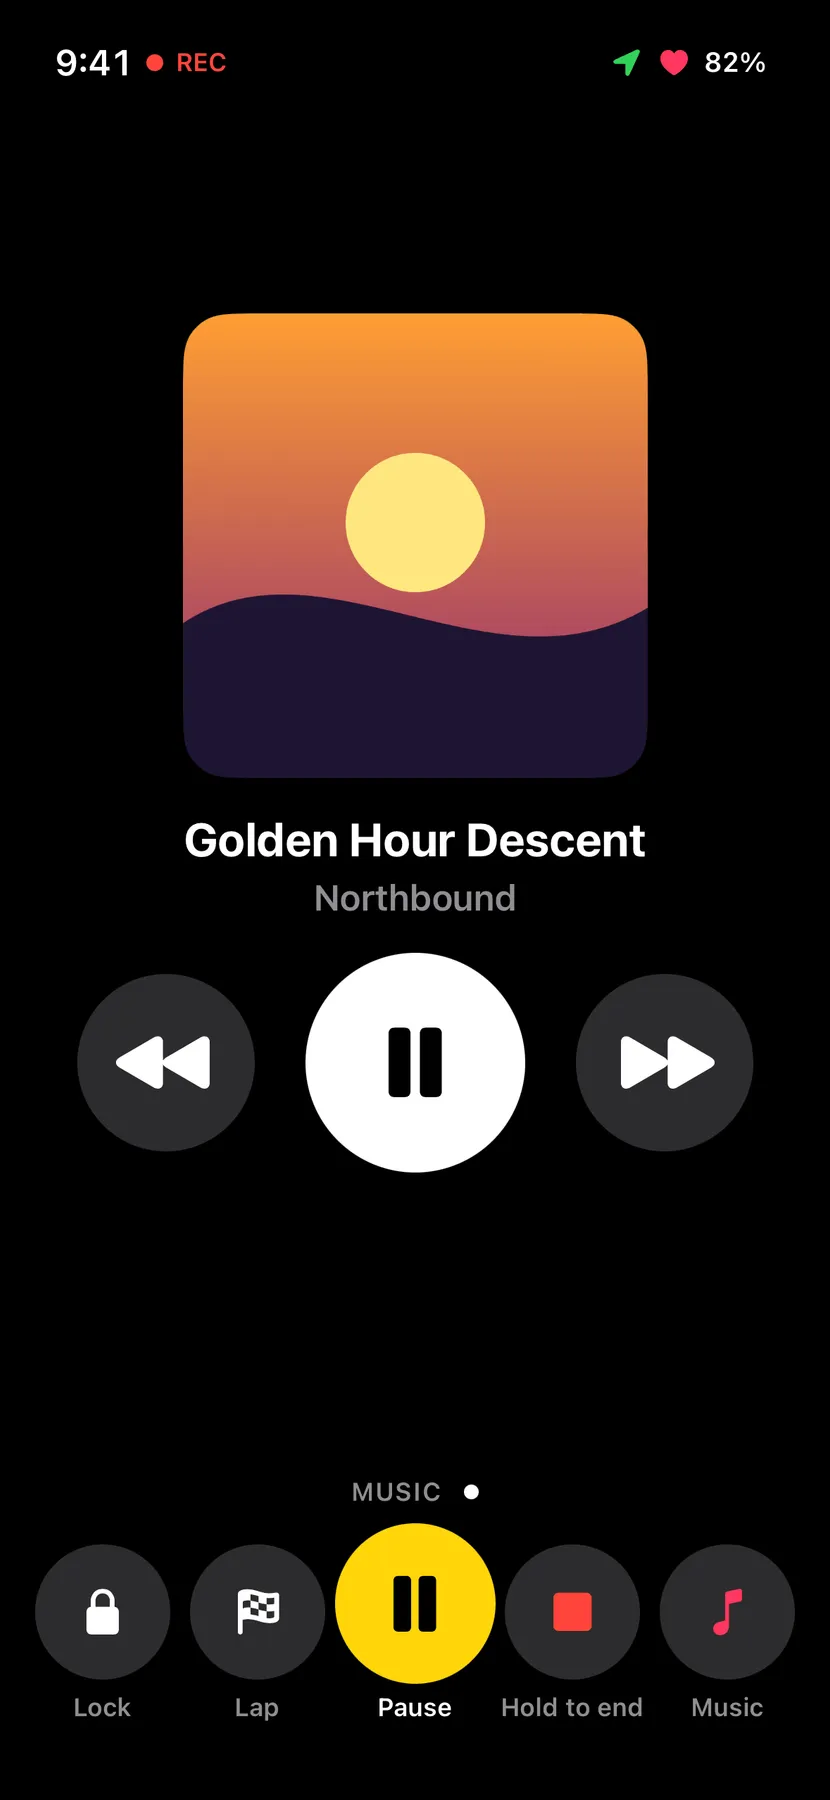
With hands on the bars, a thumb reaches the side of the screen more easily than the bottom. So I asked for the ride buttons to be able to run down the right or left edge, as an option. Music became one of them: tap it, and the buttons turn into music controls for eight seconds.
- (open larger image)
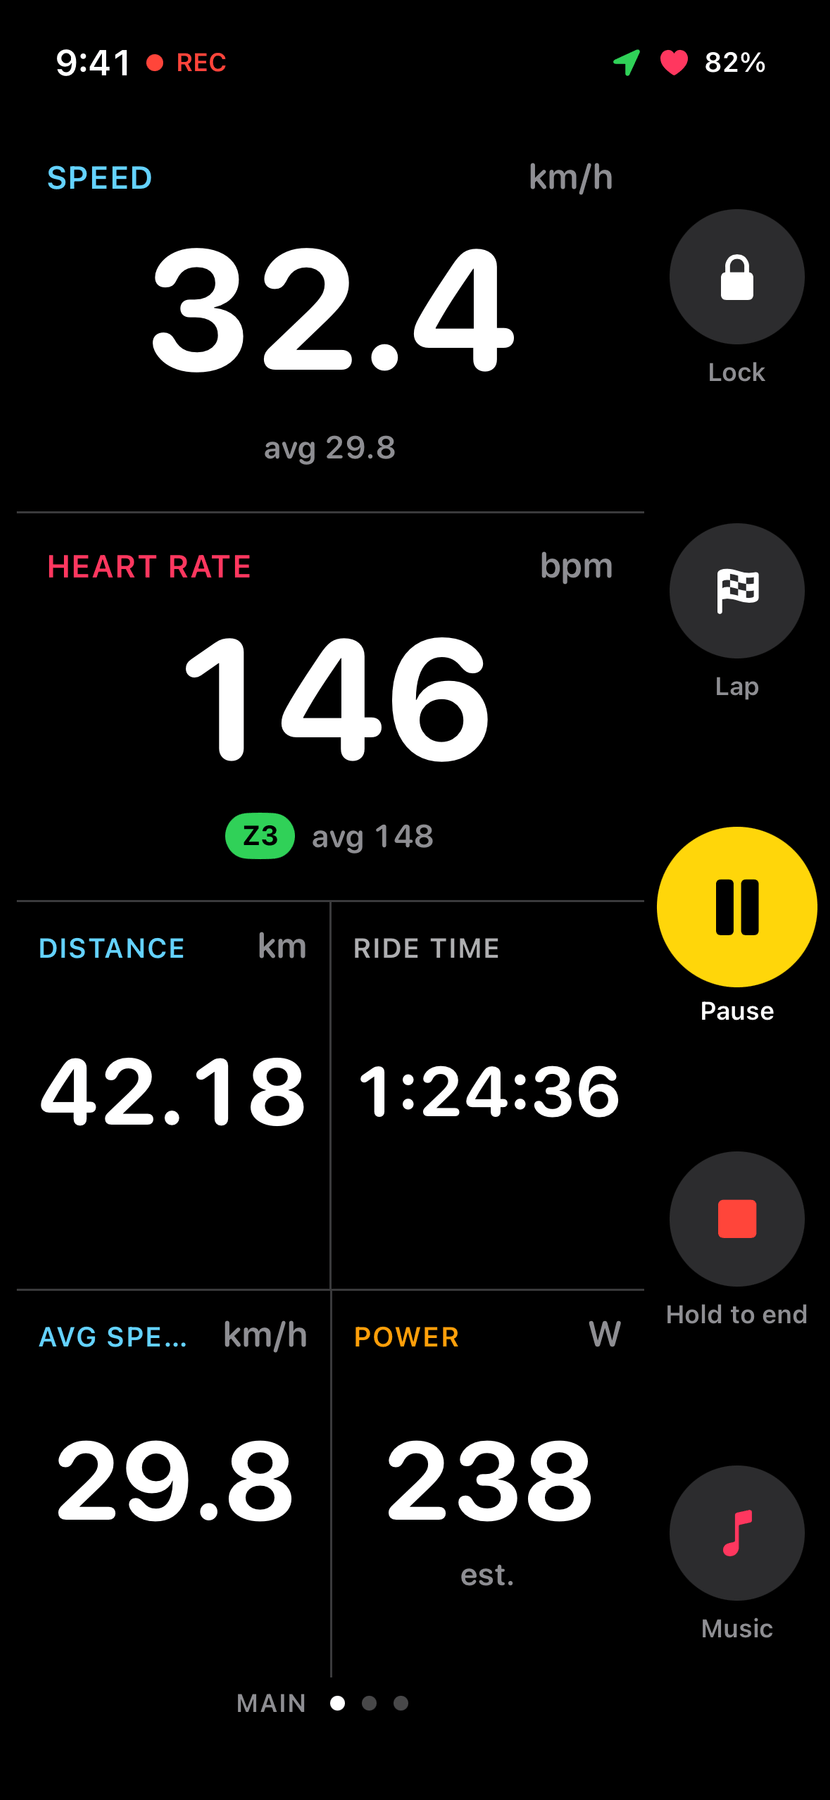
Down the right: Lock, Lap, Pause, Hold to end and Music. - (open larger image)
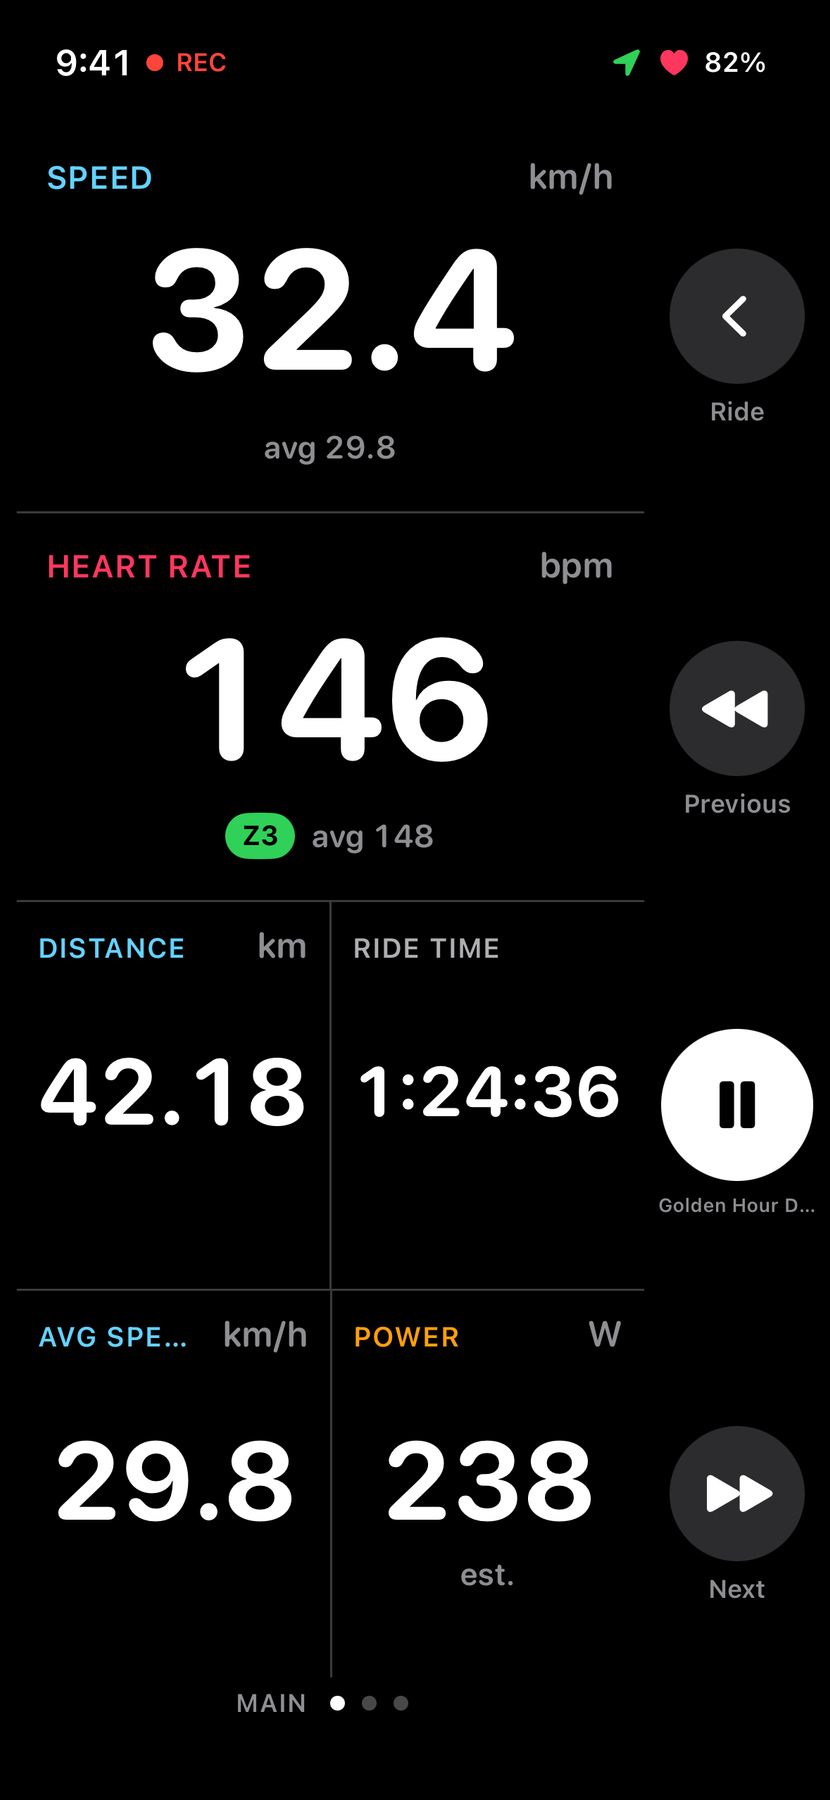
Tap Music: Back, Previous, Play/Pause and Next. - (open larger image)
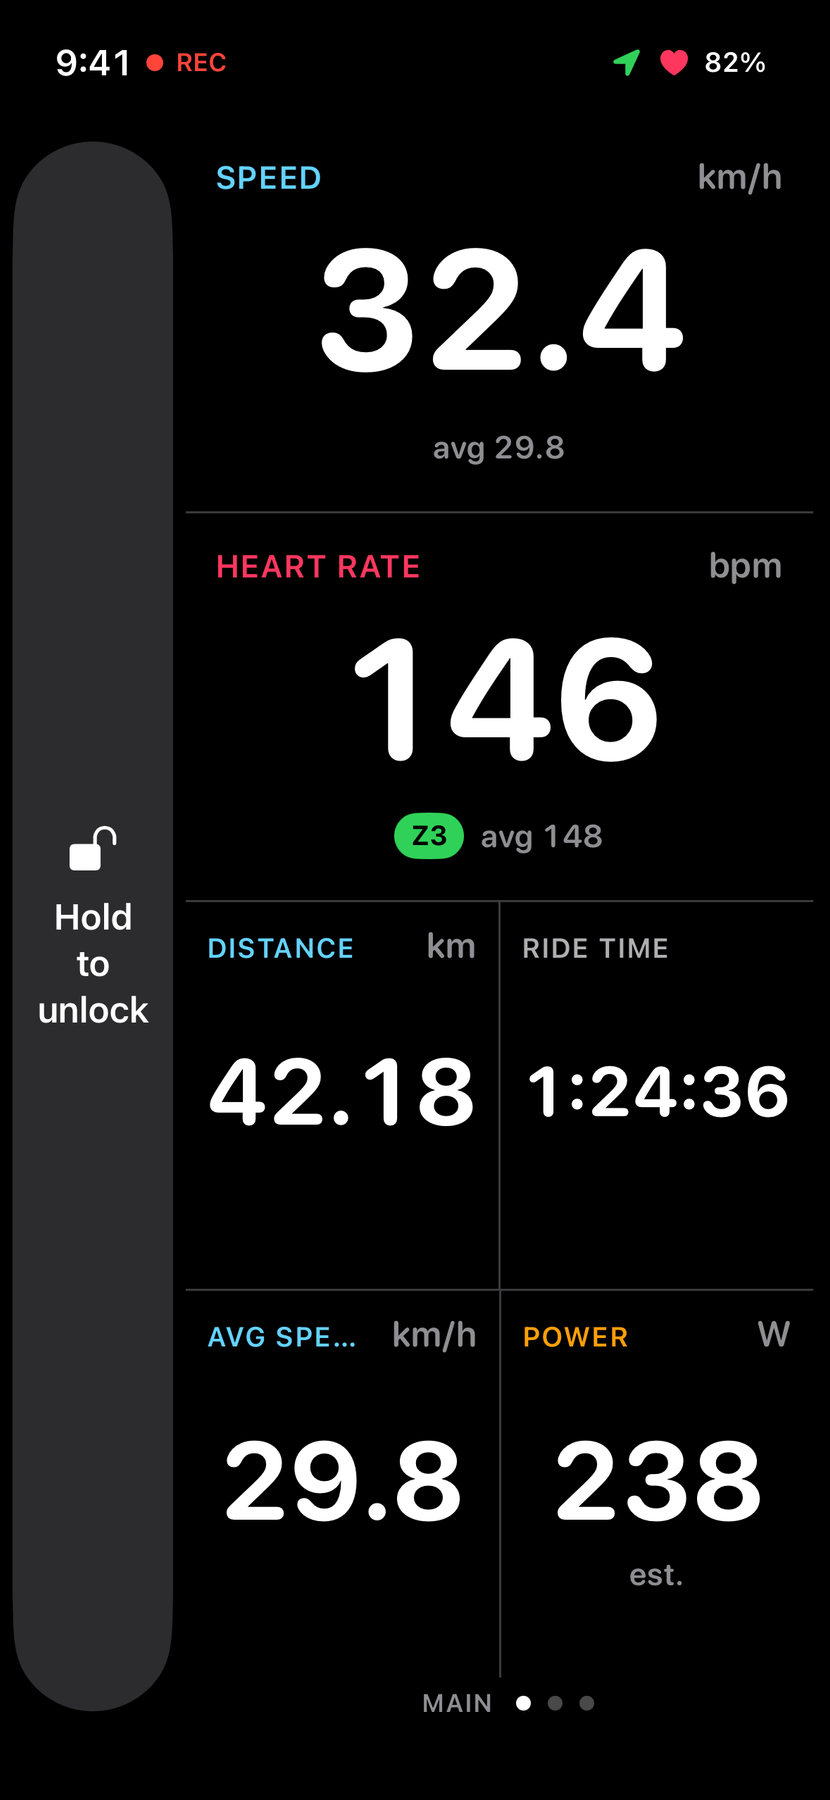
On the left, locked: one tall hold-to-unlock bar. - (open larger image)
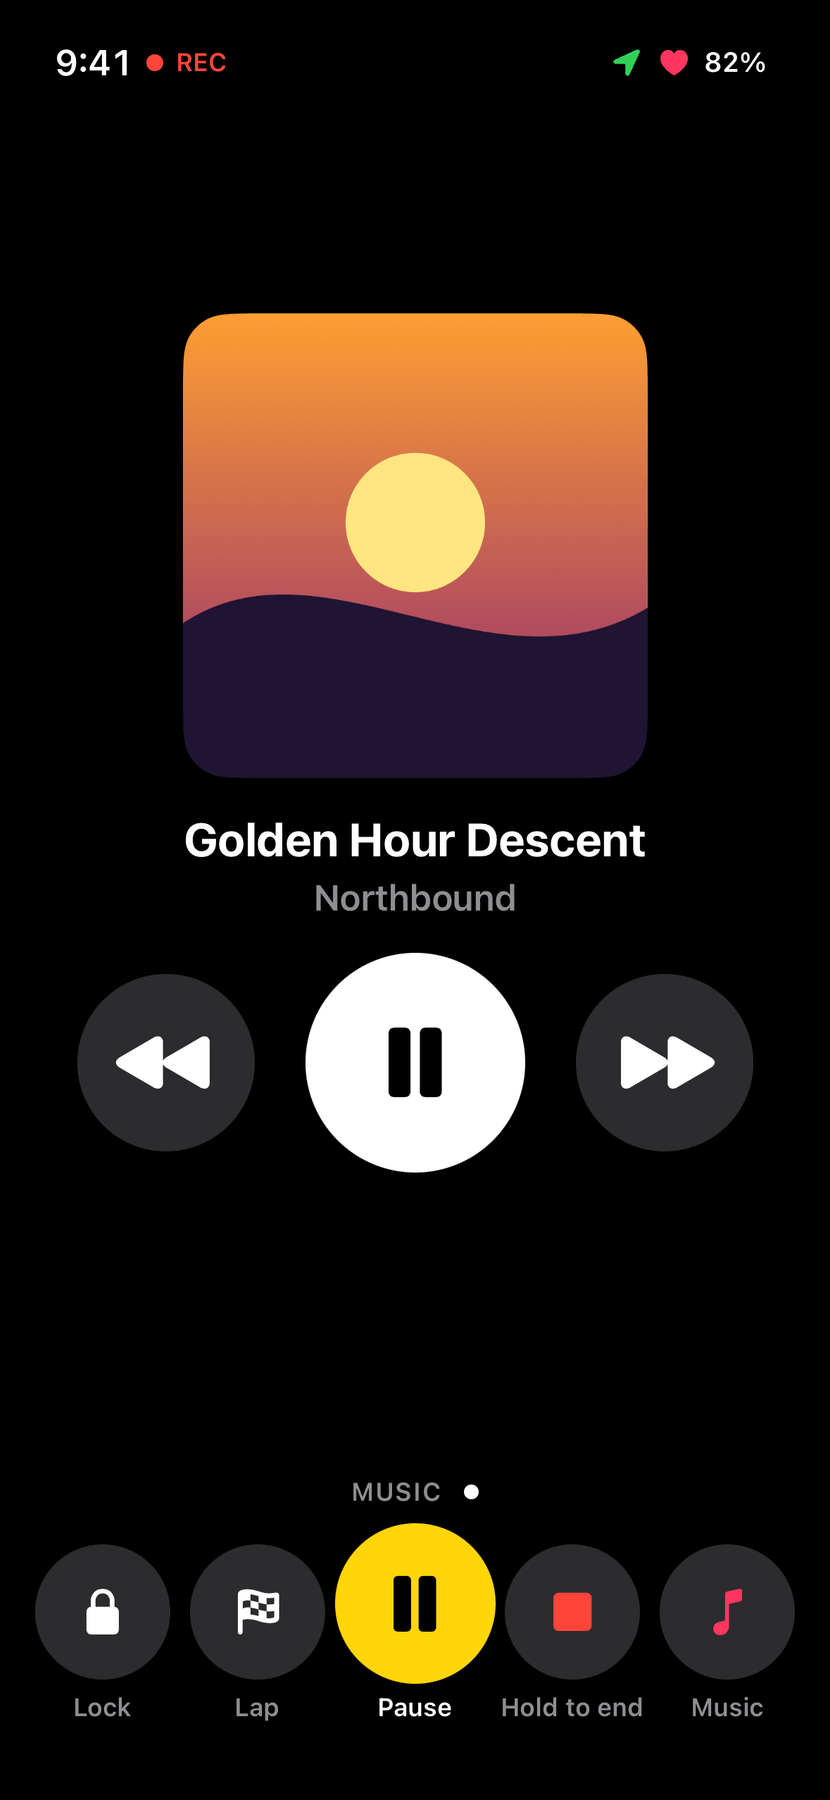
A Music page, with huge buttons.
Three ride modes
Before a ride, I choose how the app spends the battery. All three modes record exactly the same data; they differ in what the screen and GPS do. Standard keeps everything live. Battery Saving keeps the screen on but dims it after ten seconds, brightening it for turns. Ultra Battery Saving lets the screen sleep: the phone wakes itself at an interval I choose and before every turn, when the Lock Screen turns yellow so it catches my eye. Each mode shows roughly how long the phone and the Garmin should last, starting from typical figures and learning from my own rides. In the saving modes, the Garmin’s GPS can stand in for the phone’s.
- (open larger image)
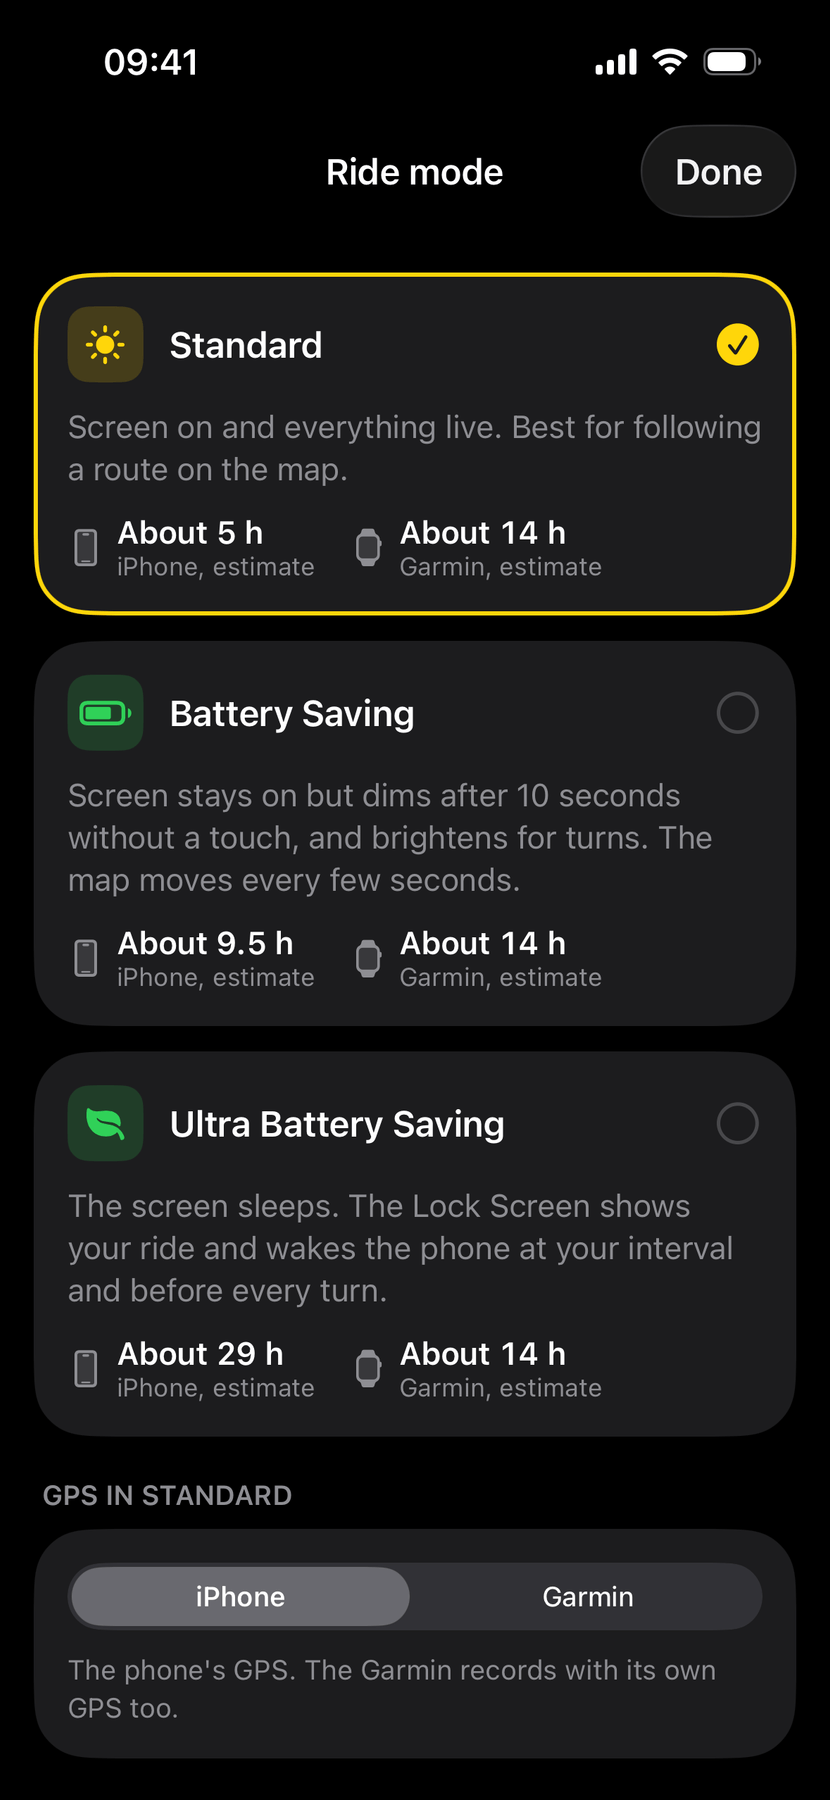
Three modes, each with battery estimates for the phone and the Garmin. - (open larger image)
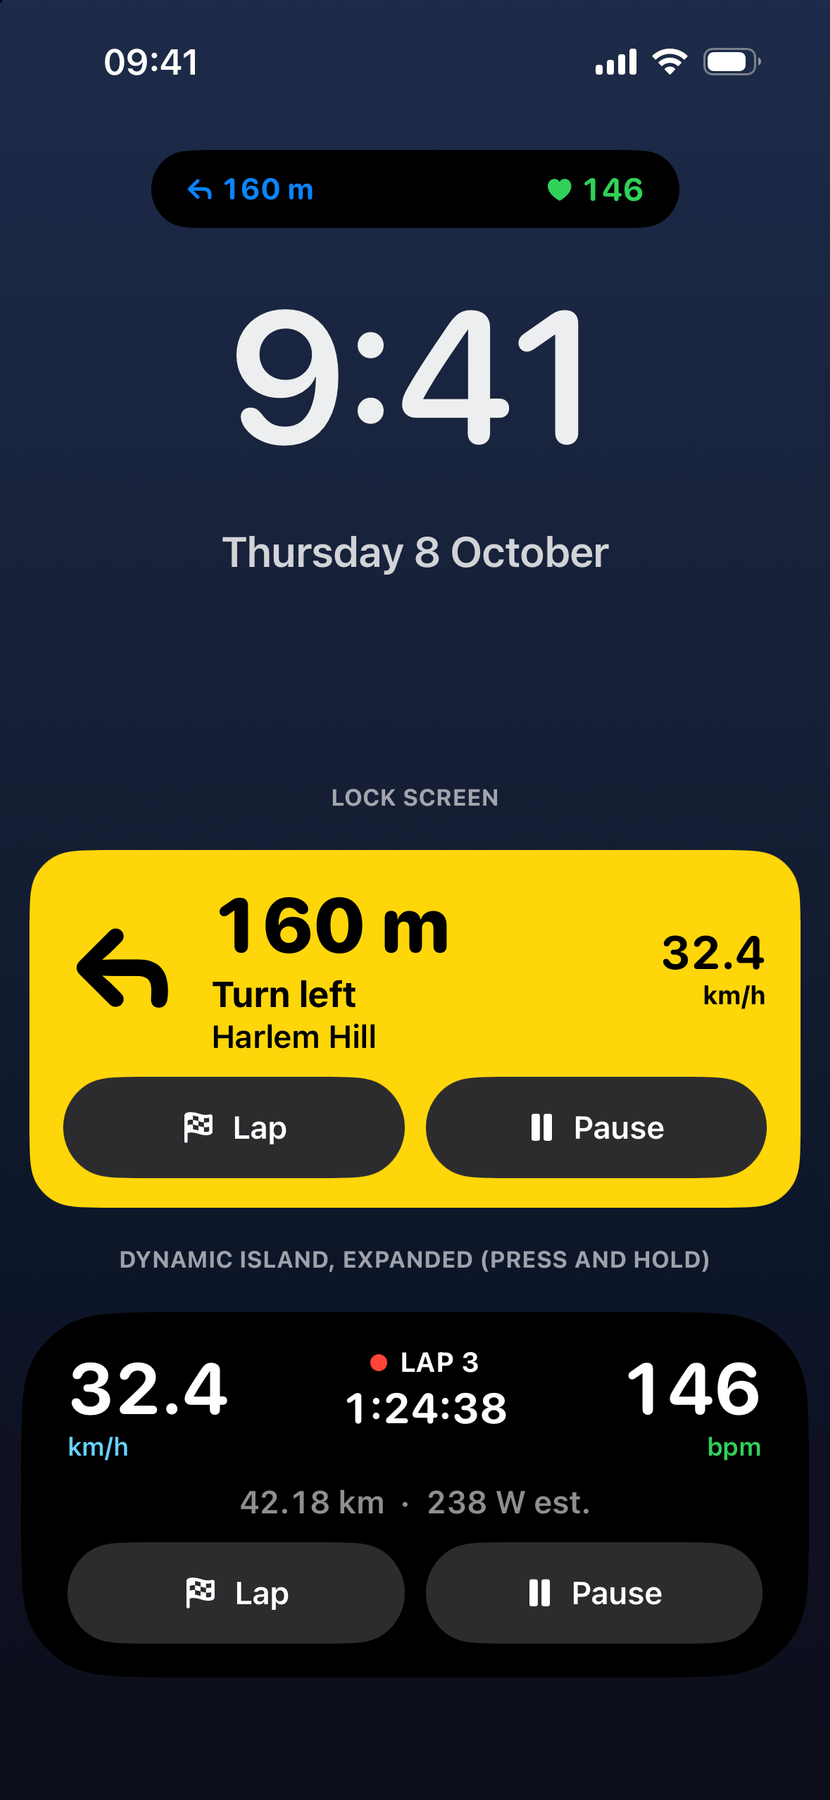
Ultra's turn wake: the Lock Screen turns yellow before each turn.
Planning a route, then following it
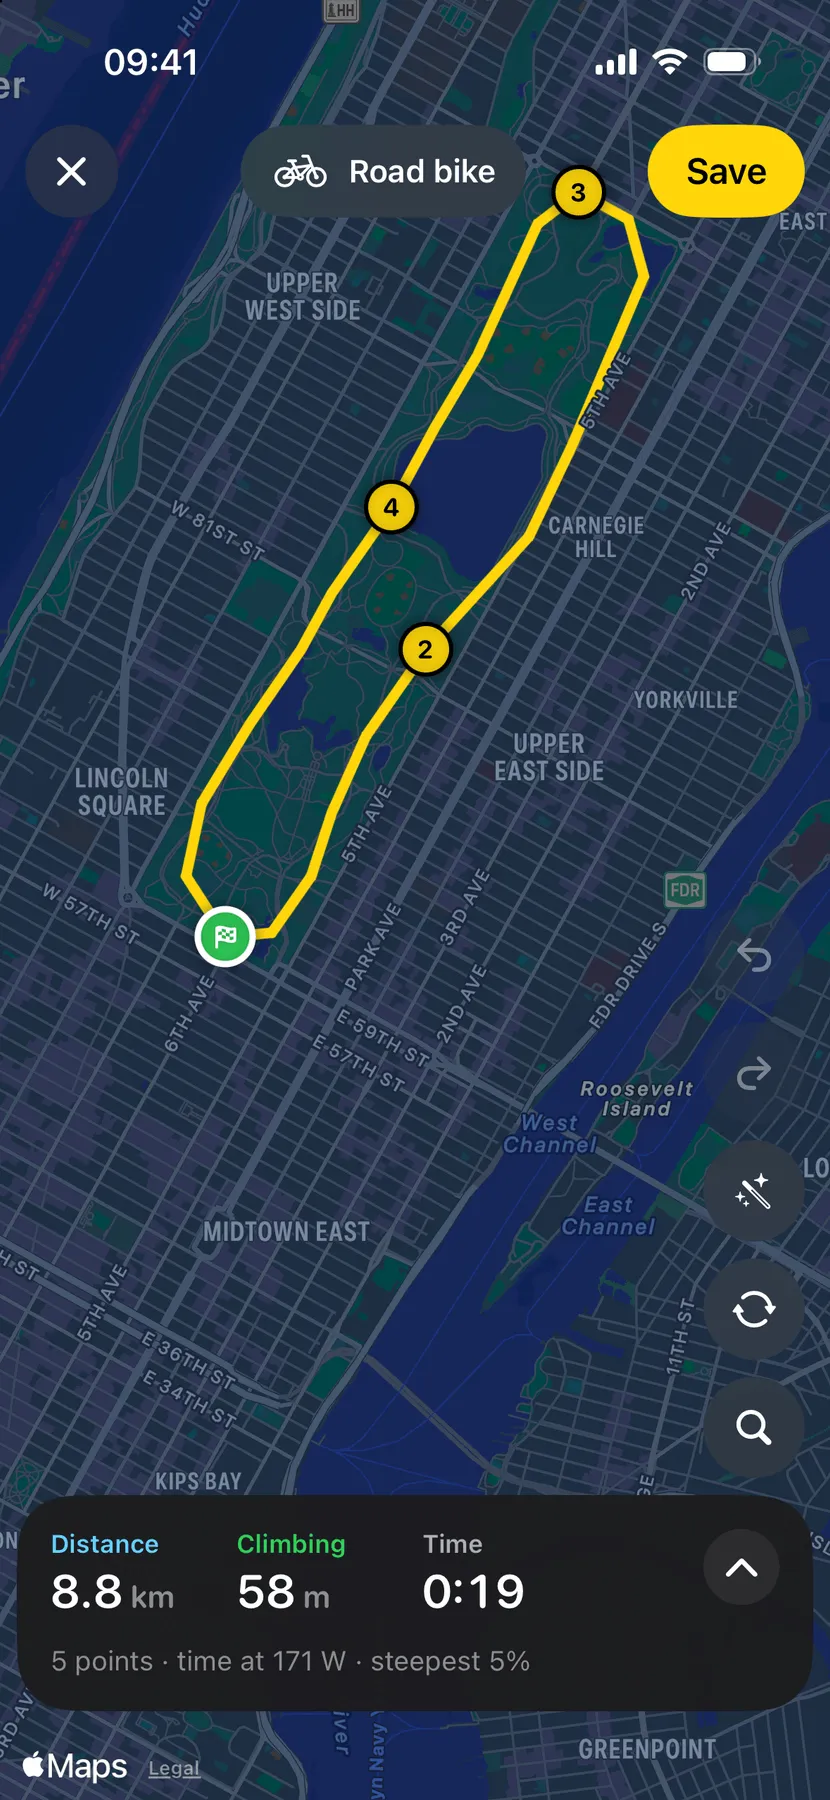
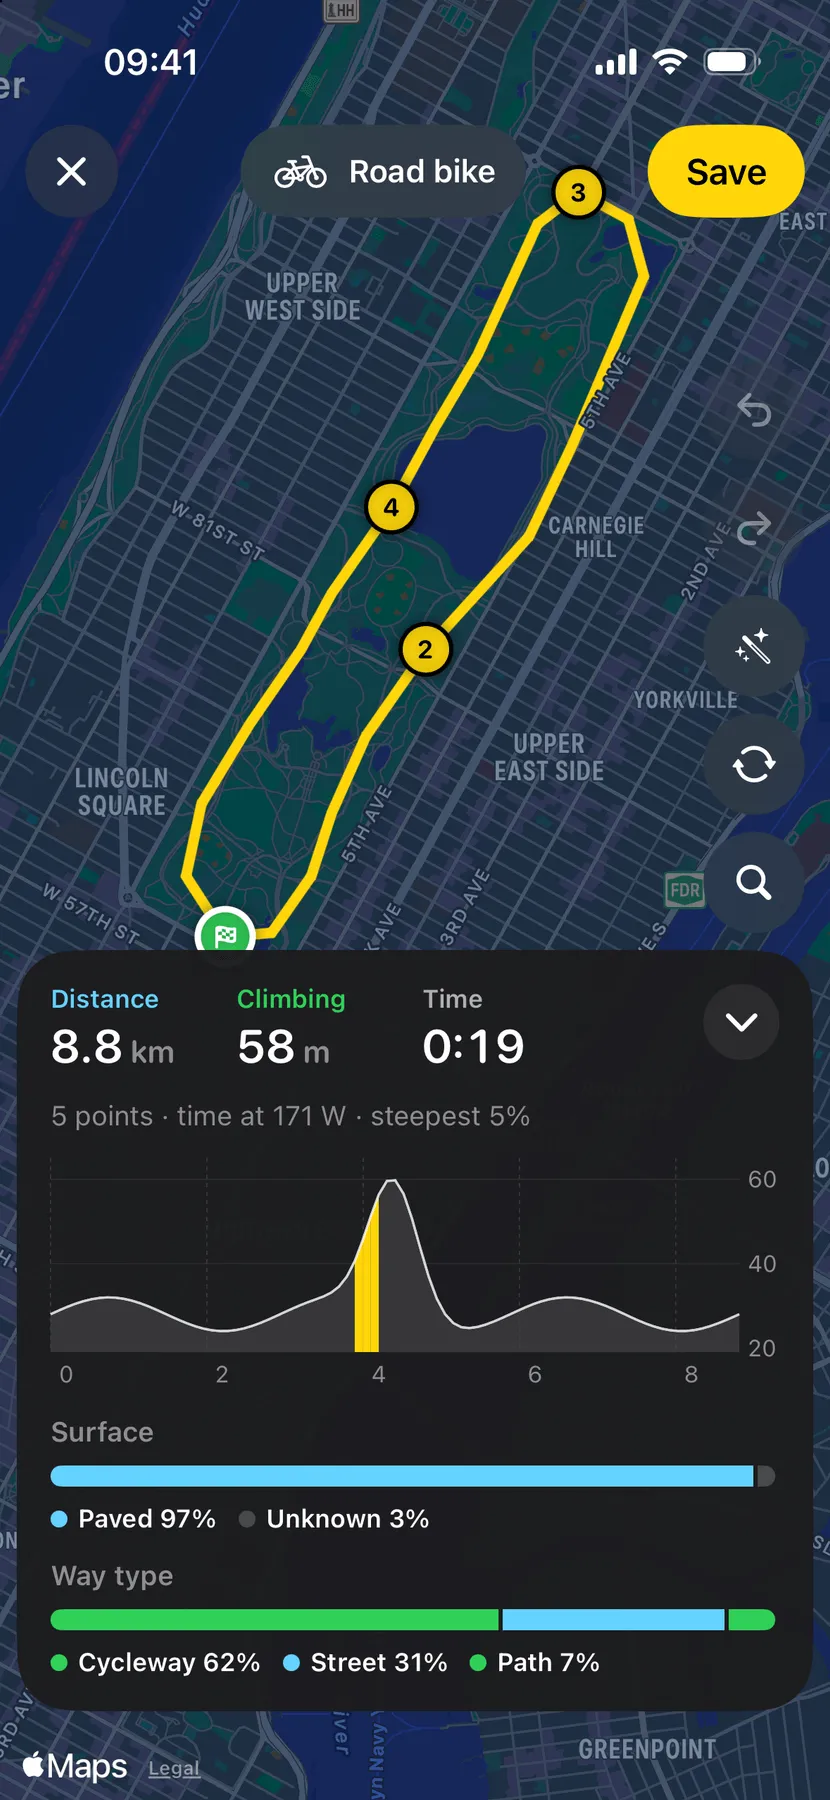
Routes are planned on the phone: tap to add a point, drag to move it, or ask for a loop of a given length. OpenRouteService picks bike-friendly roads. On the ride, turns are read out loud with the music turned down, with a chime from the side of the turn first when earbuds are in. Going off route for 40 metres for five seconds brings a buzz, a beep and a way back.
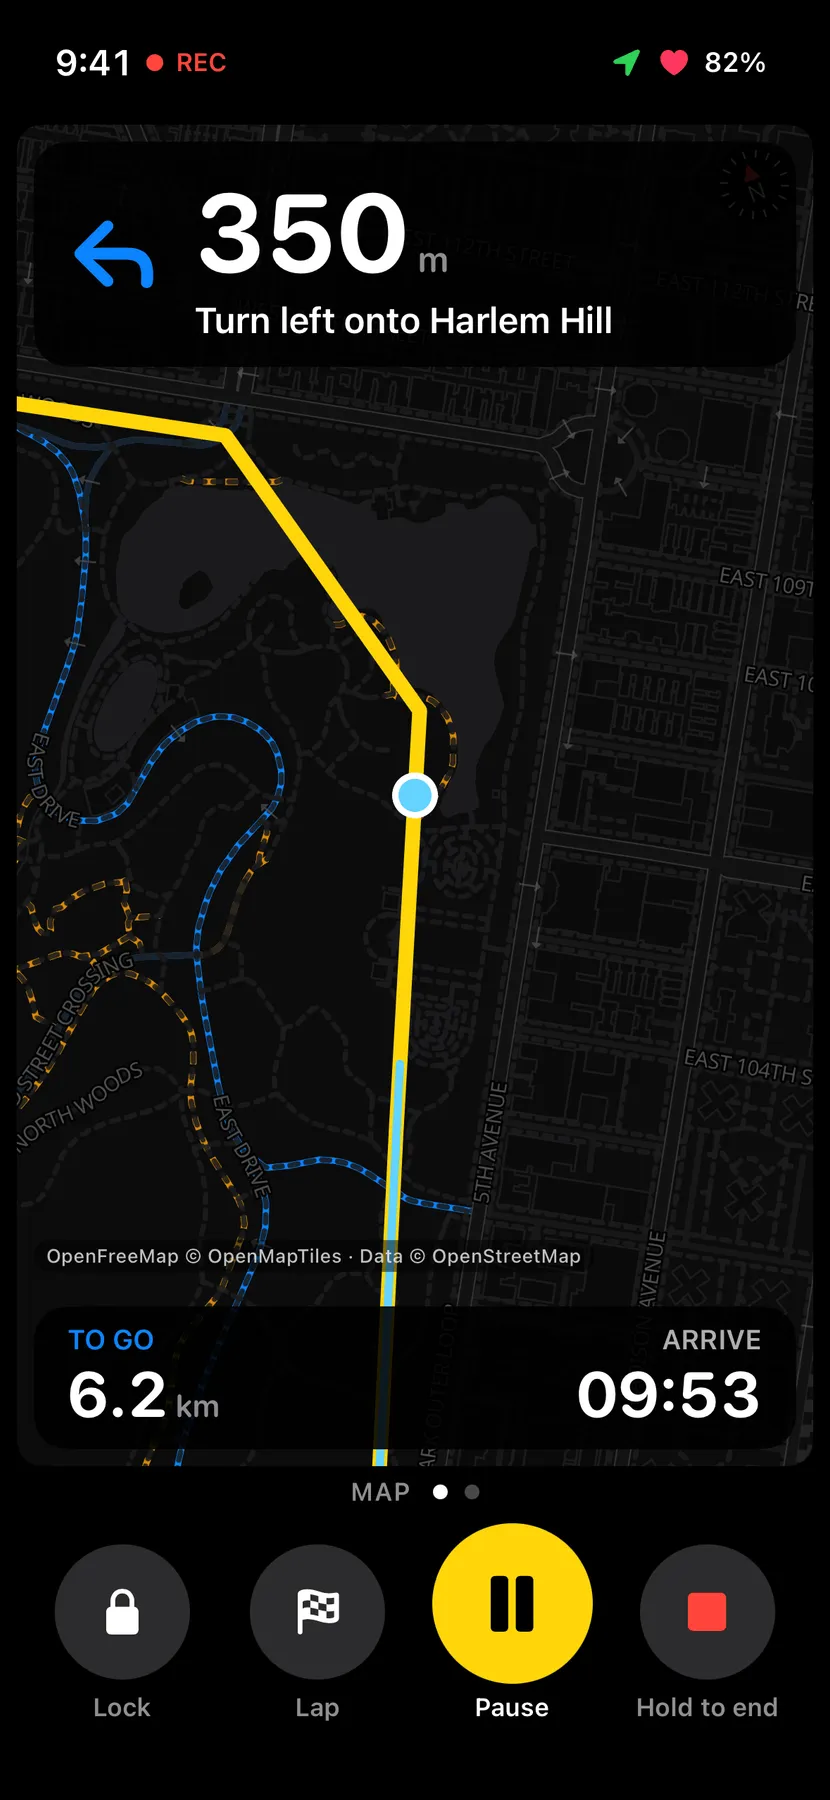
Apple doesn’t let apps download its maps, so the Map page can also use MapLibre, an open map engine, with OpenFreeMap’s free map. Its dark style highlights cycleways and marks unpaved tracks, and the map along a saved route can be downloaded for riding without signal.
- (open larger image)
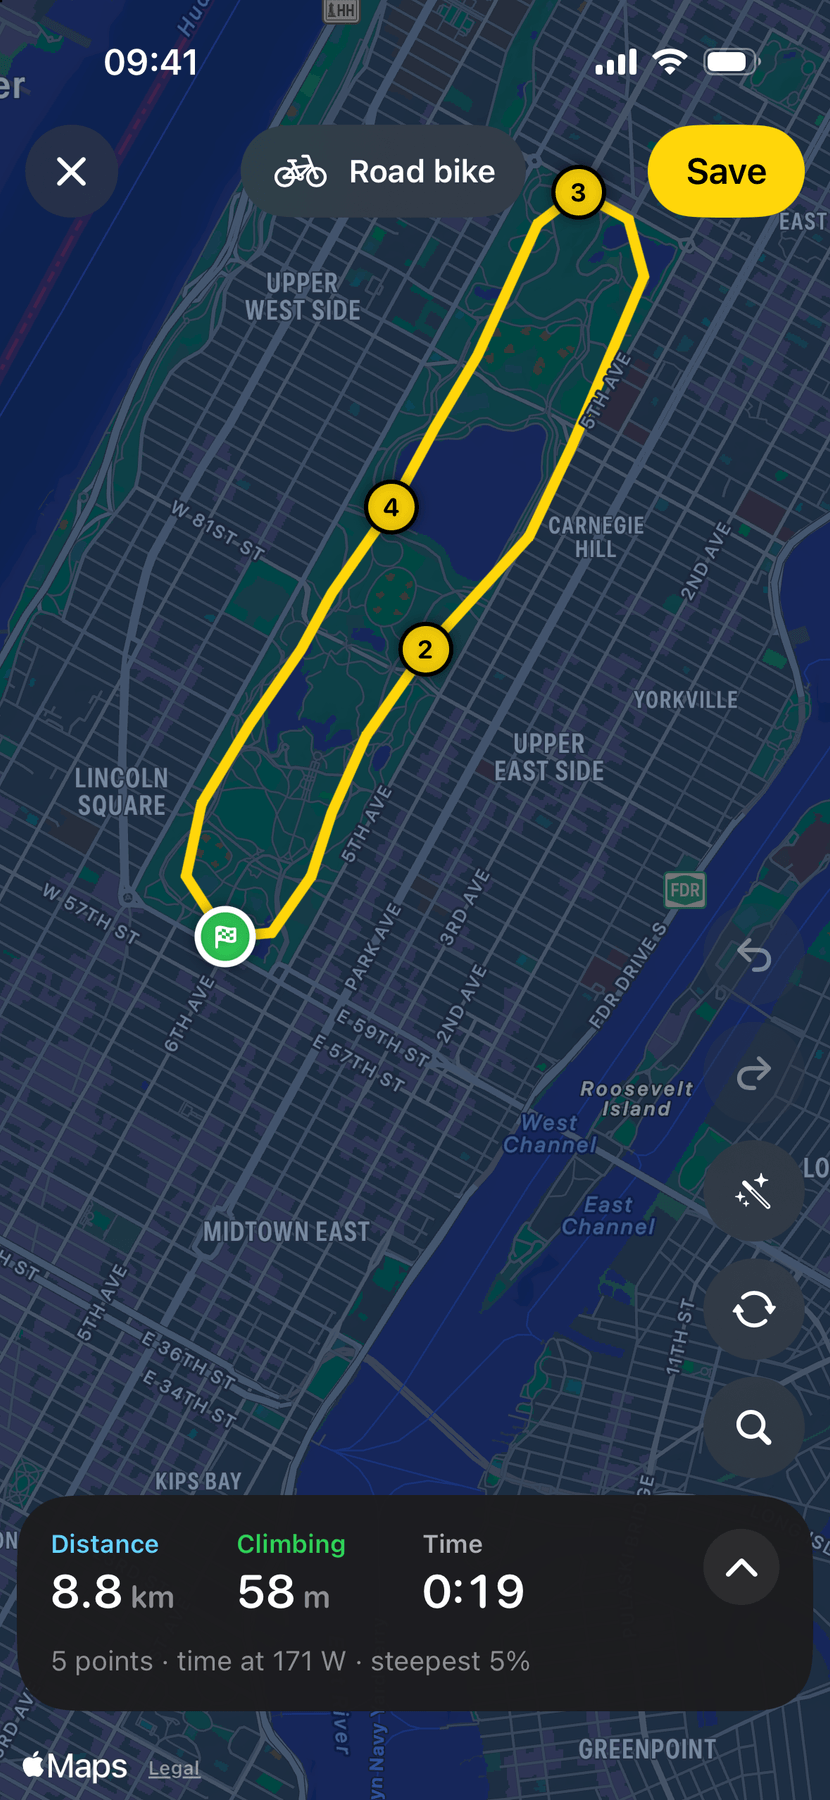
Plan by tapping the map. - (open larger image)
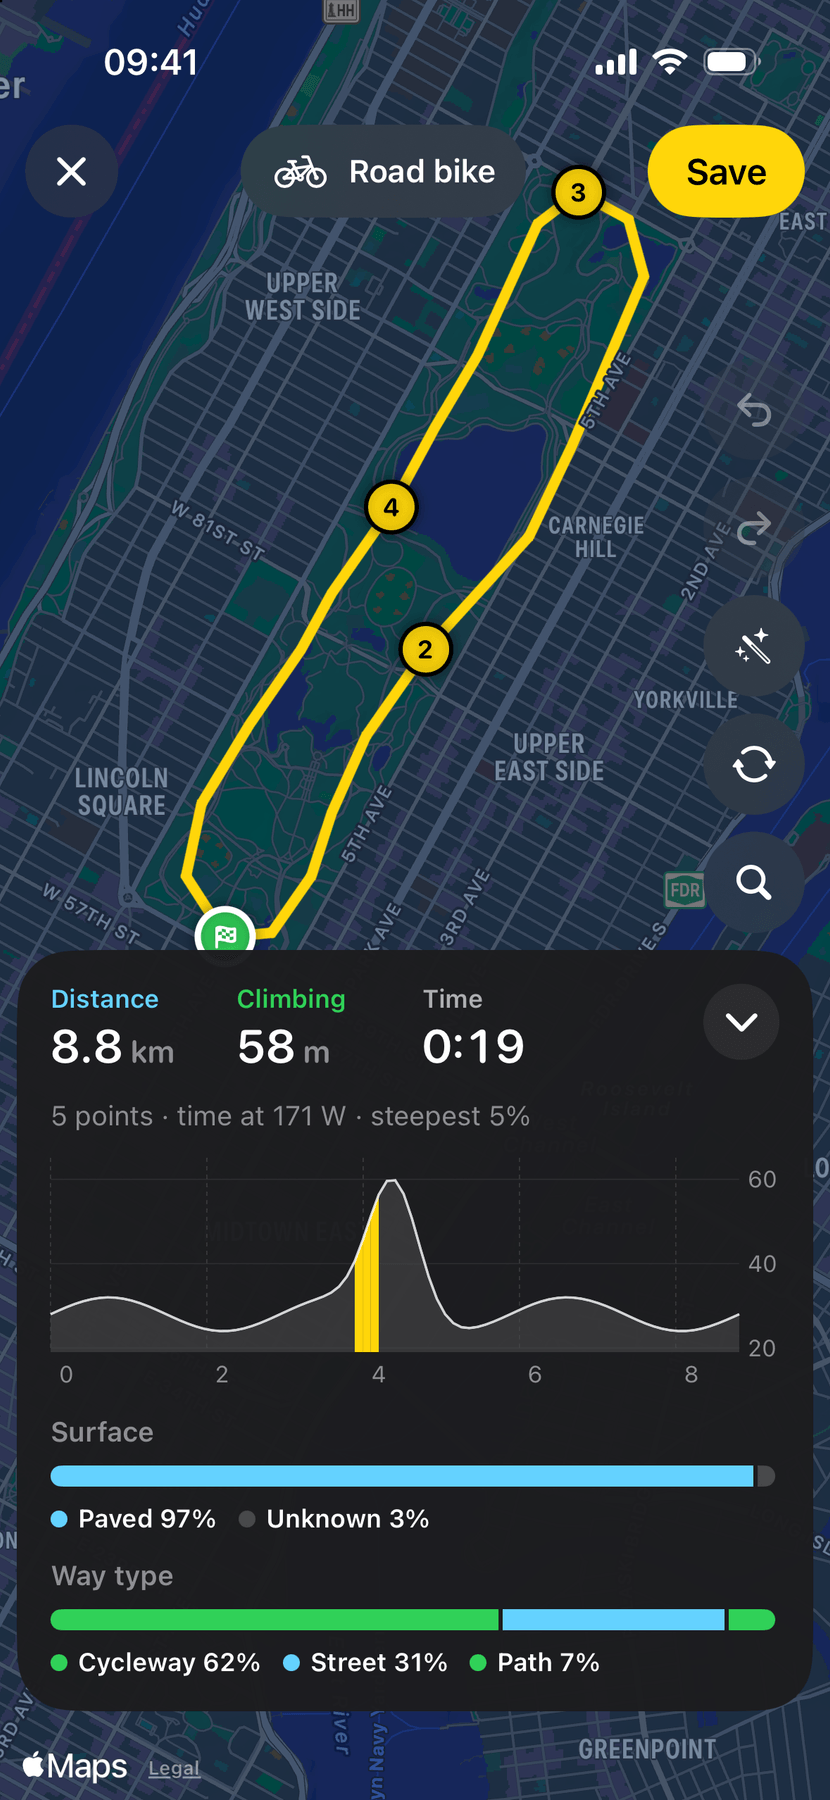
Height, surface and the kind of road. - (open larger image)
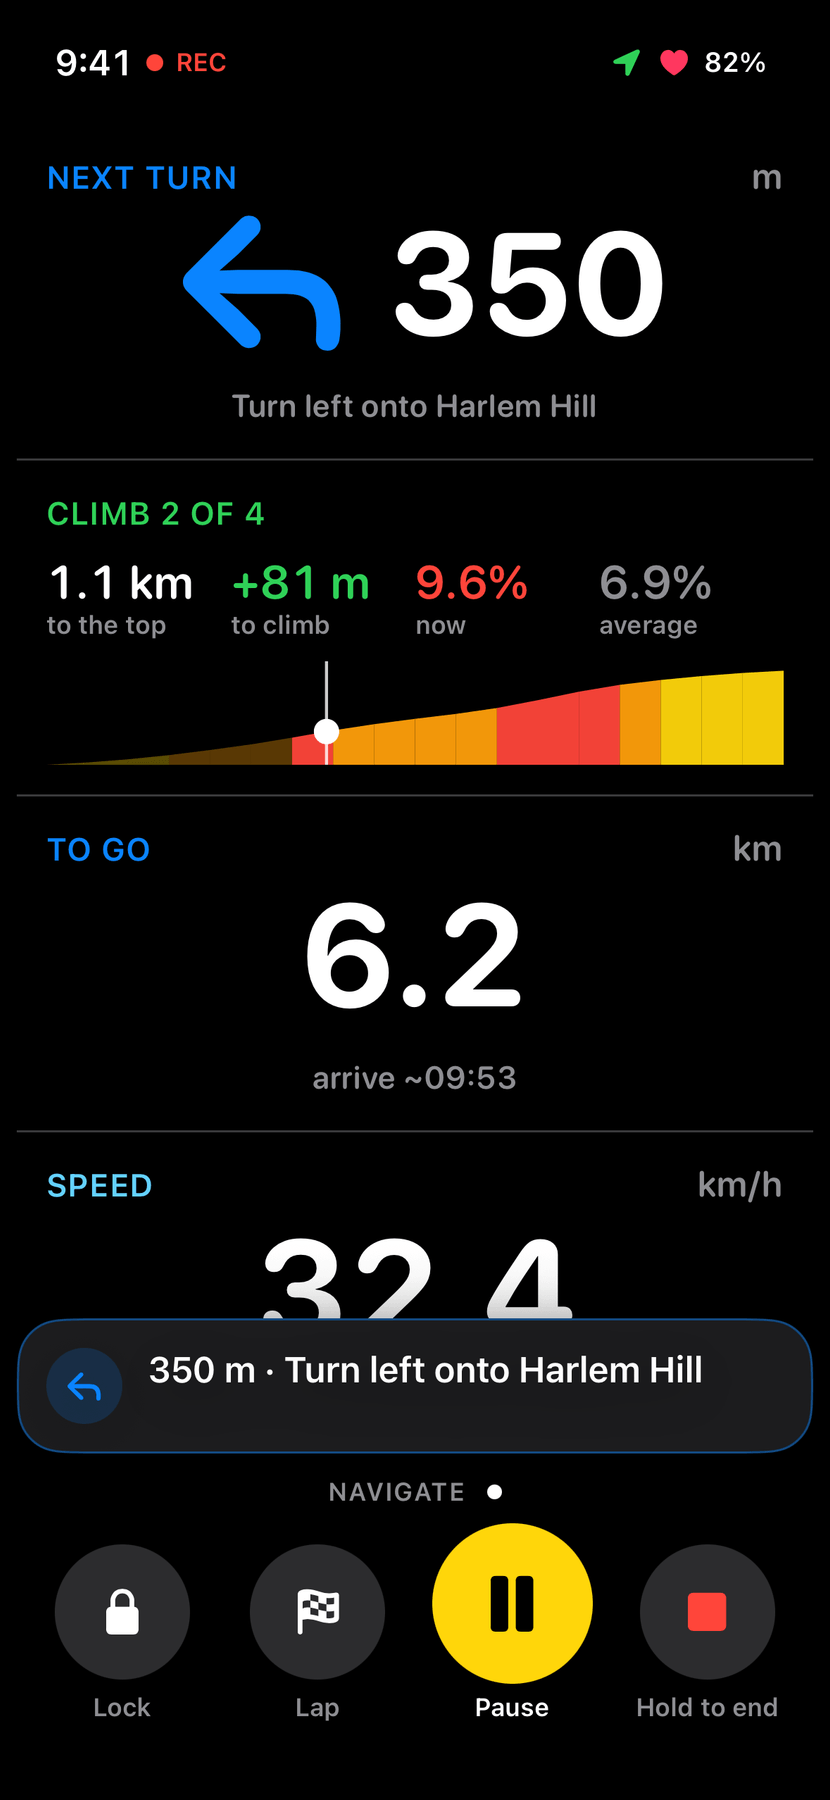
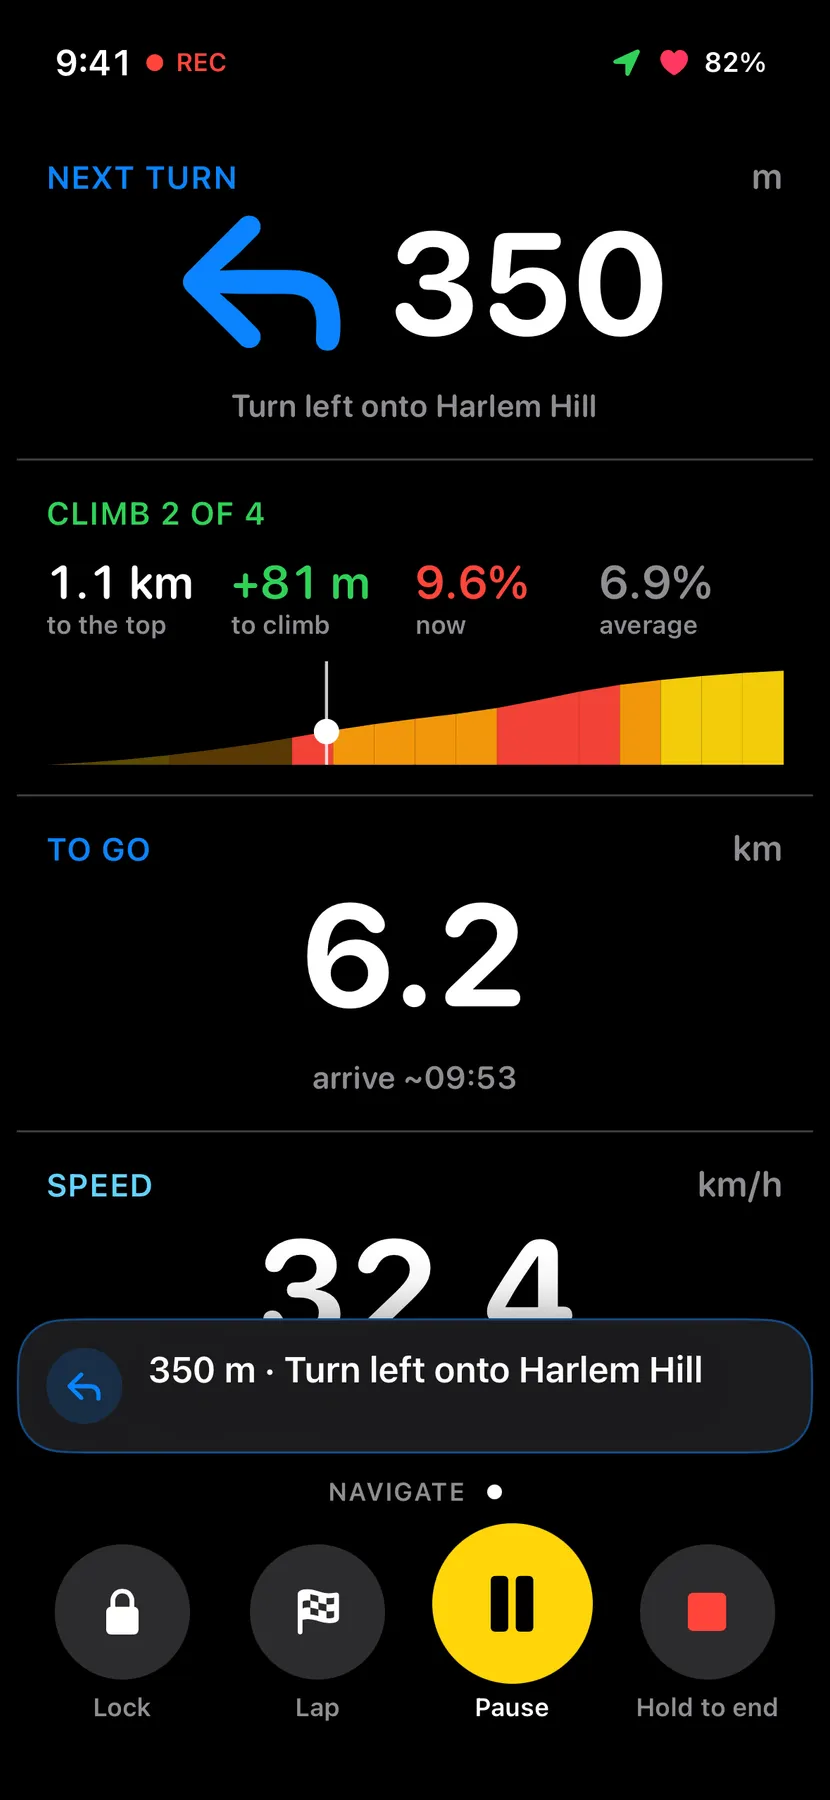
The next turn, the climb ahead and the distance to go. - (open larger image)
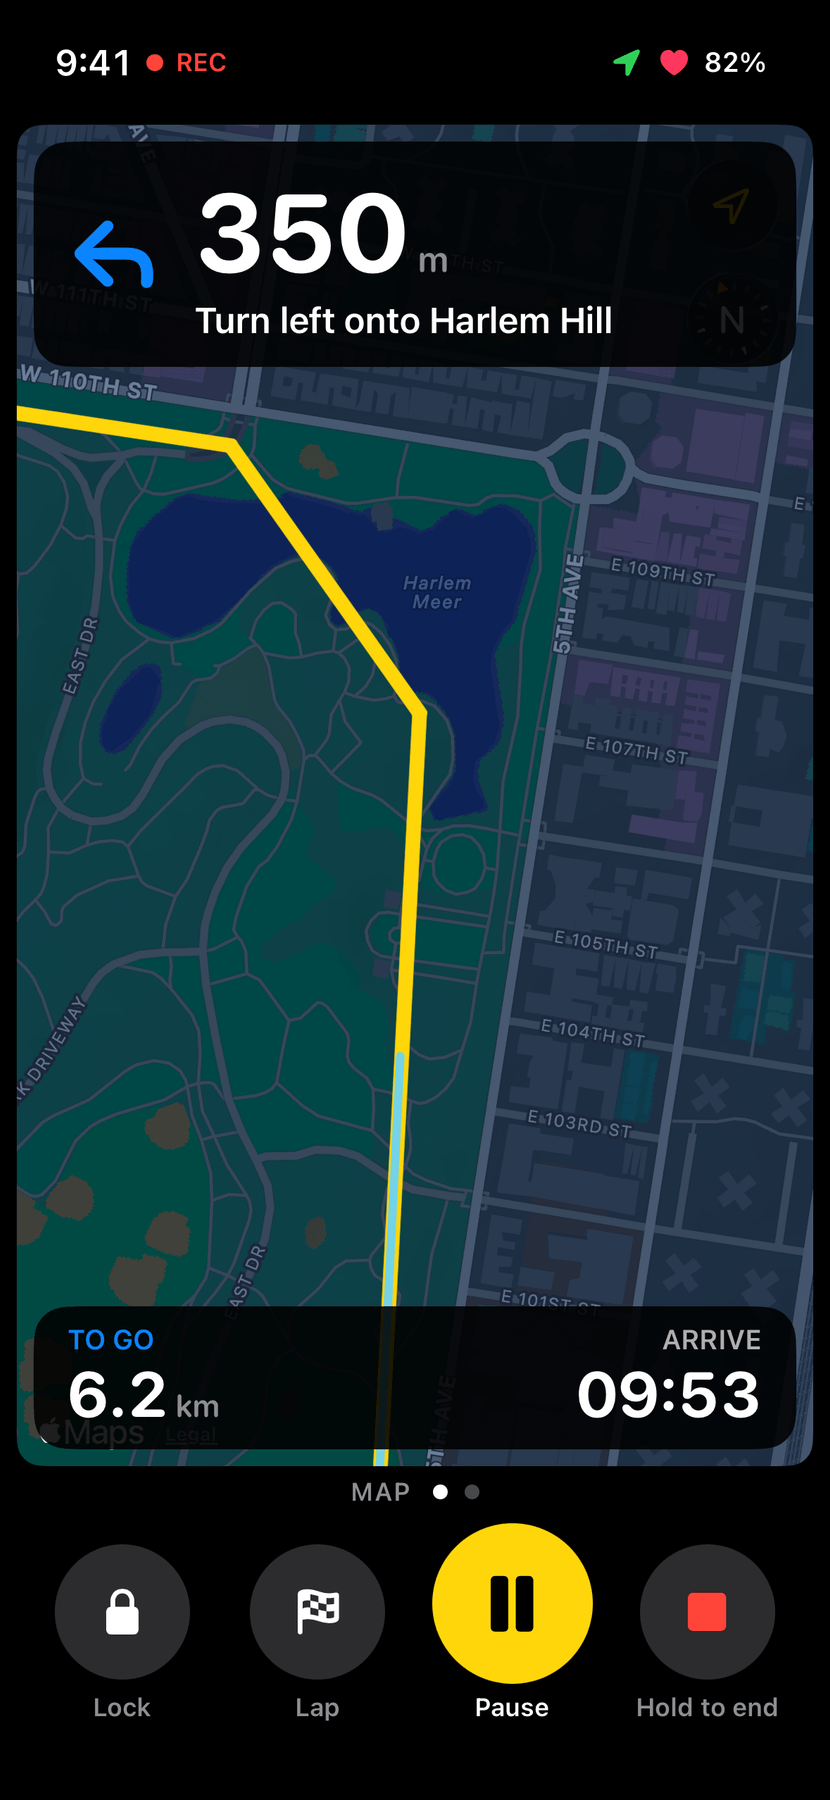
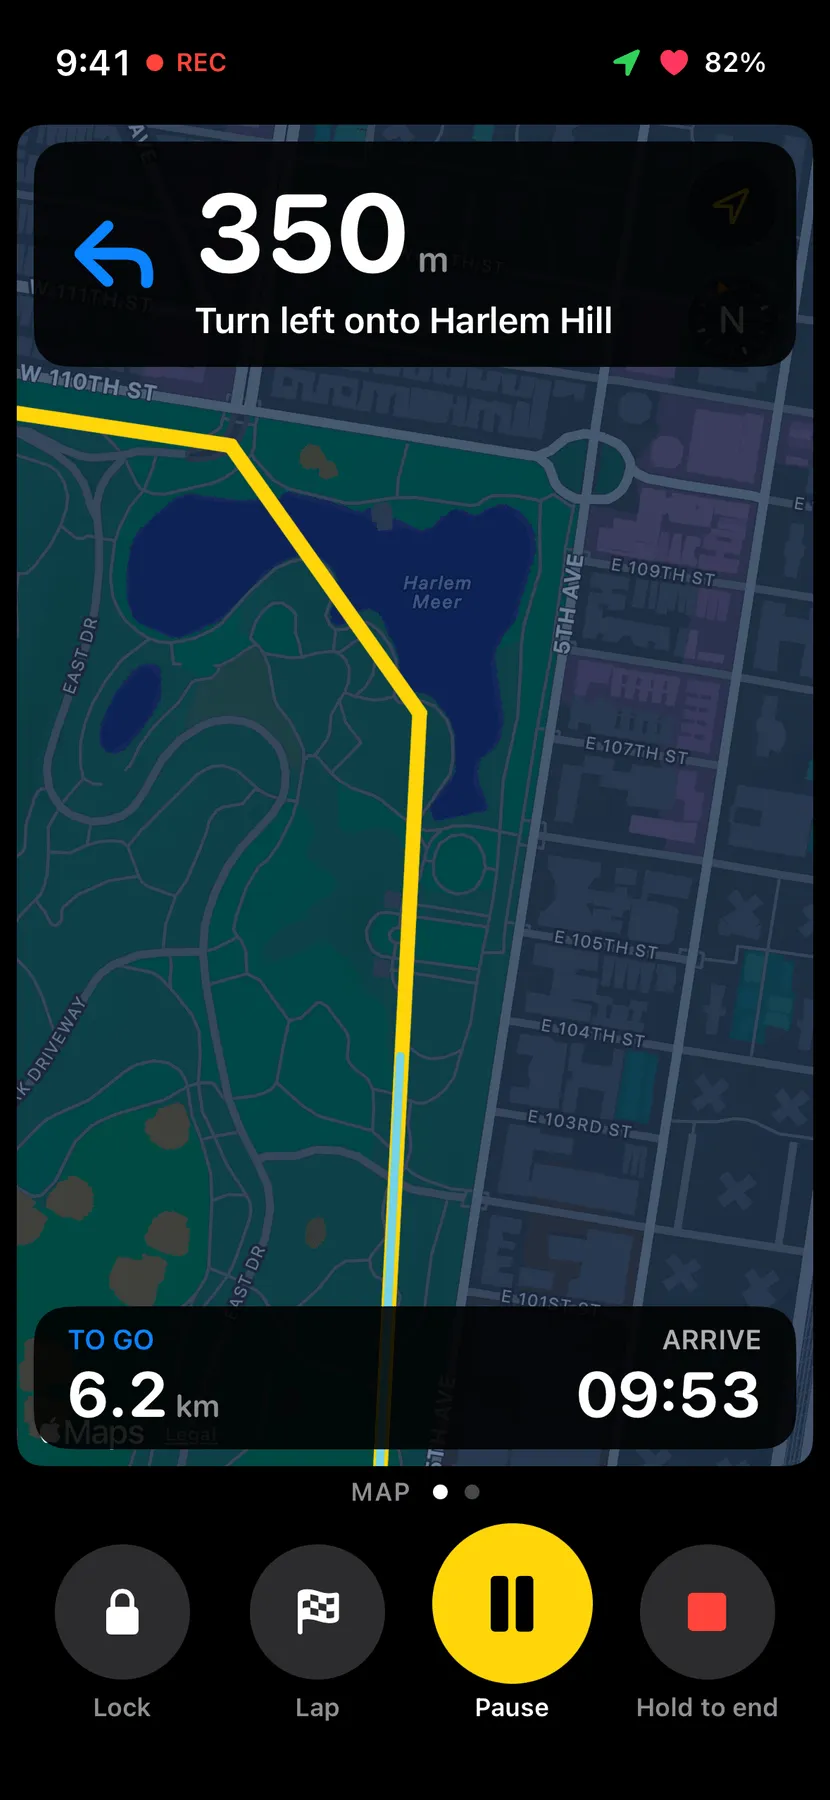
The Map page: the only page with a live map, to save battery. - (open larger image)
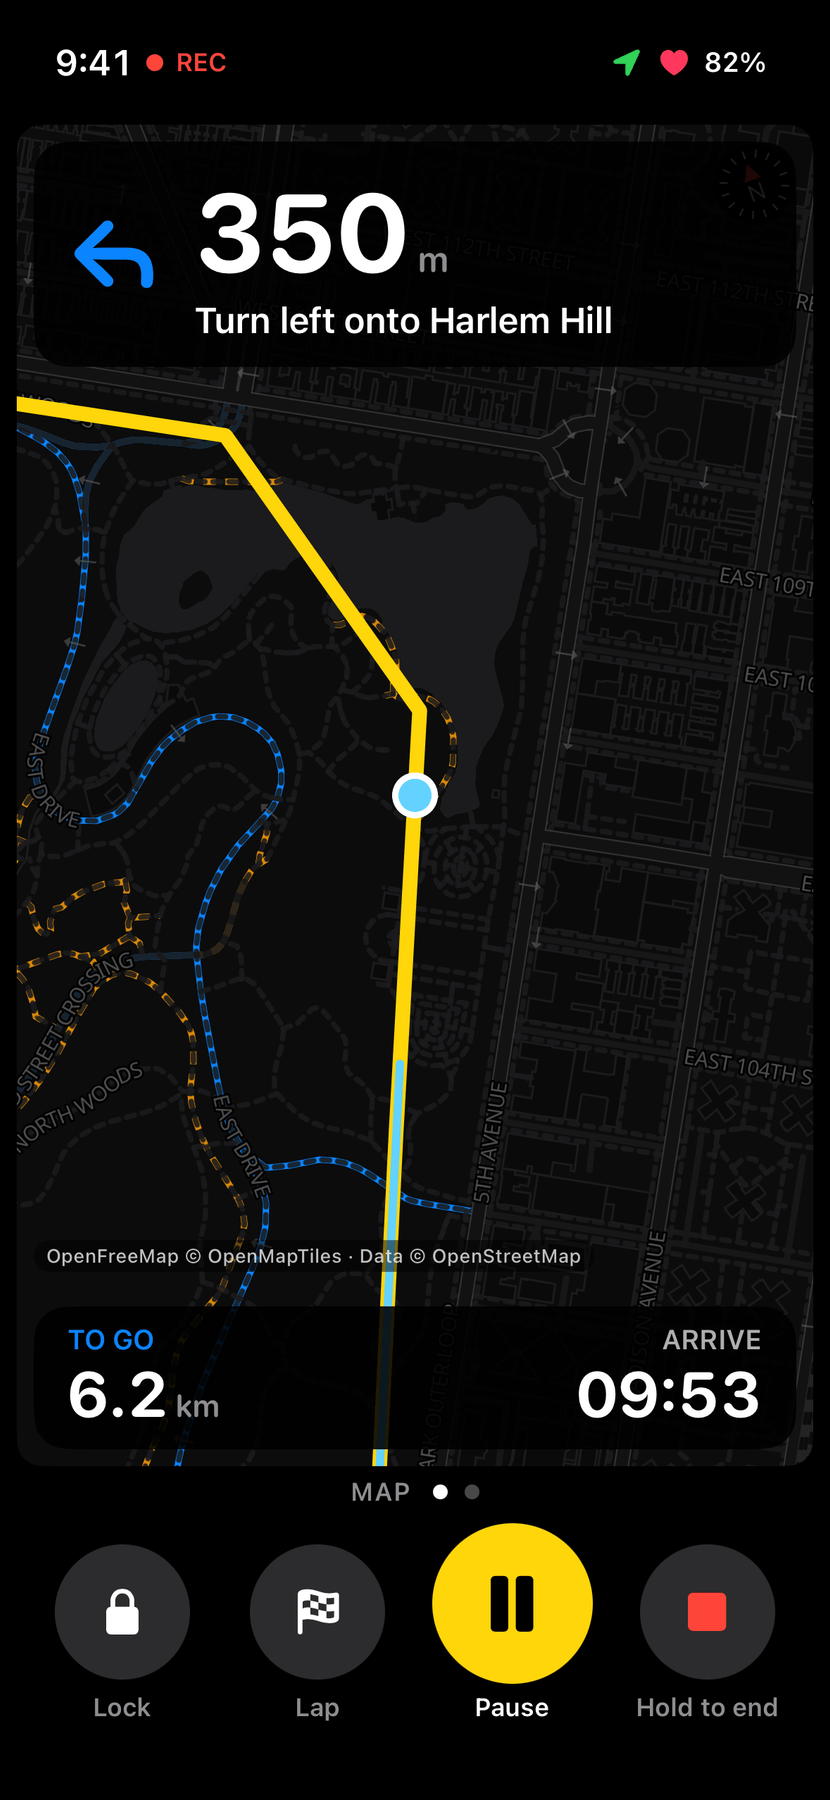
The MapLibre map: cycleways in blue, unpaved tracks dashed, downloadable for offline rides. - (open larger image)
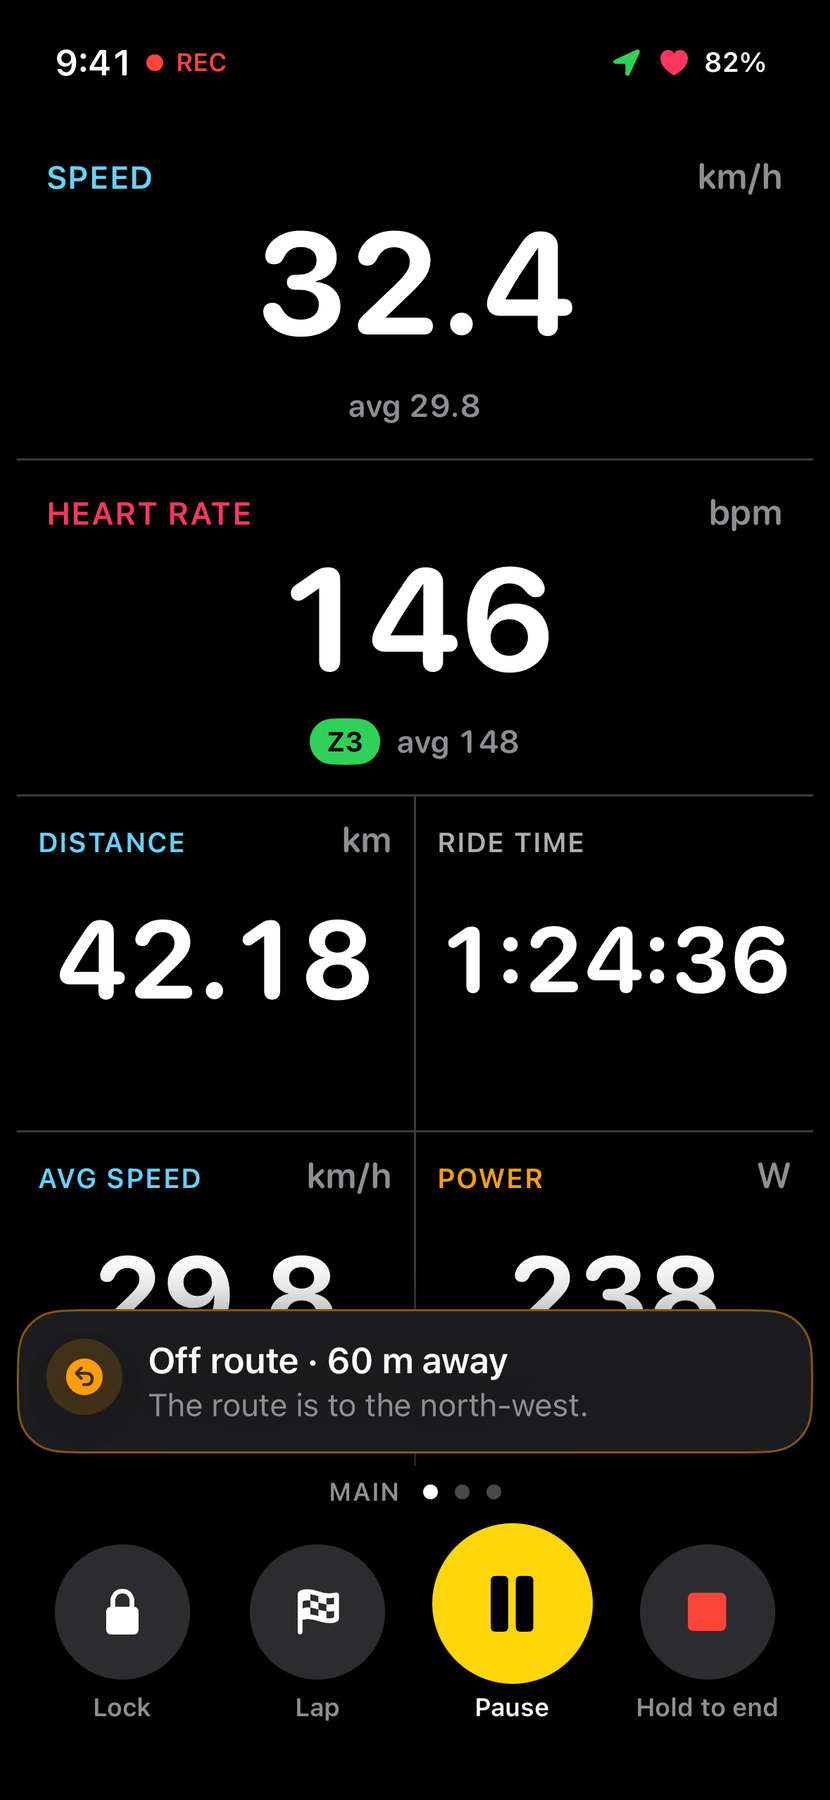
Off route: how far, and which way back. - (open larger image)
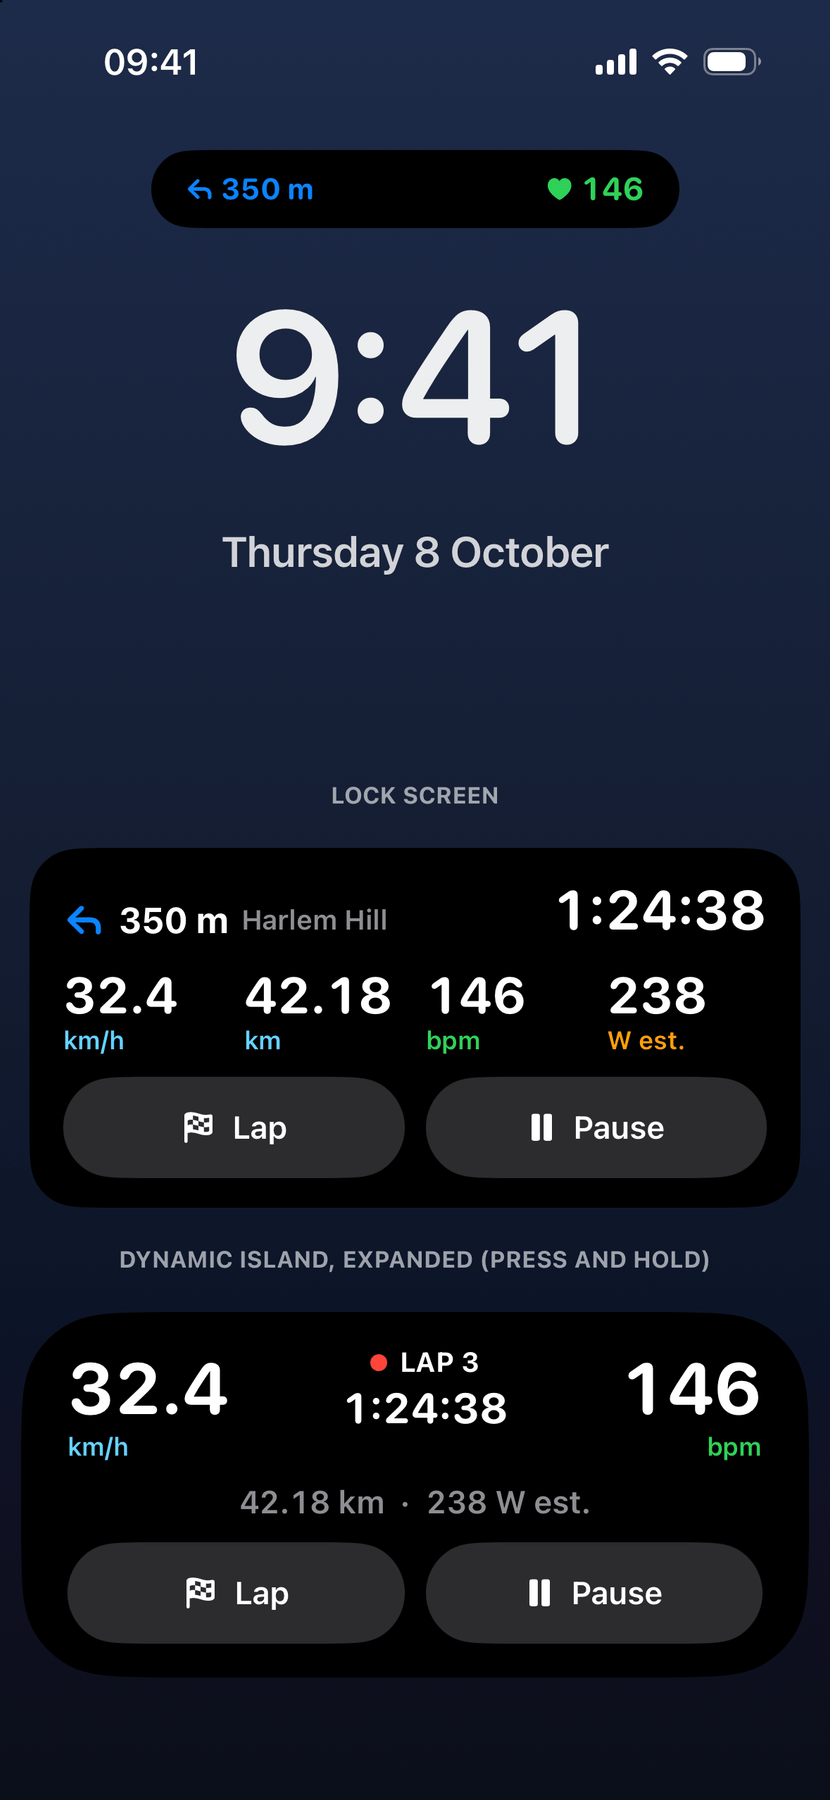
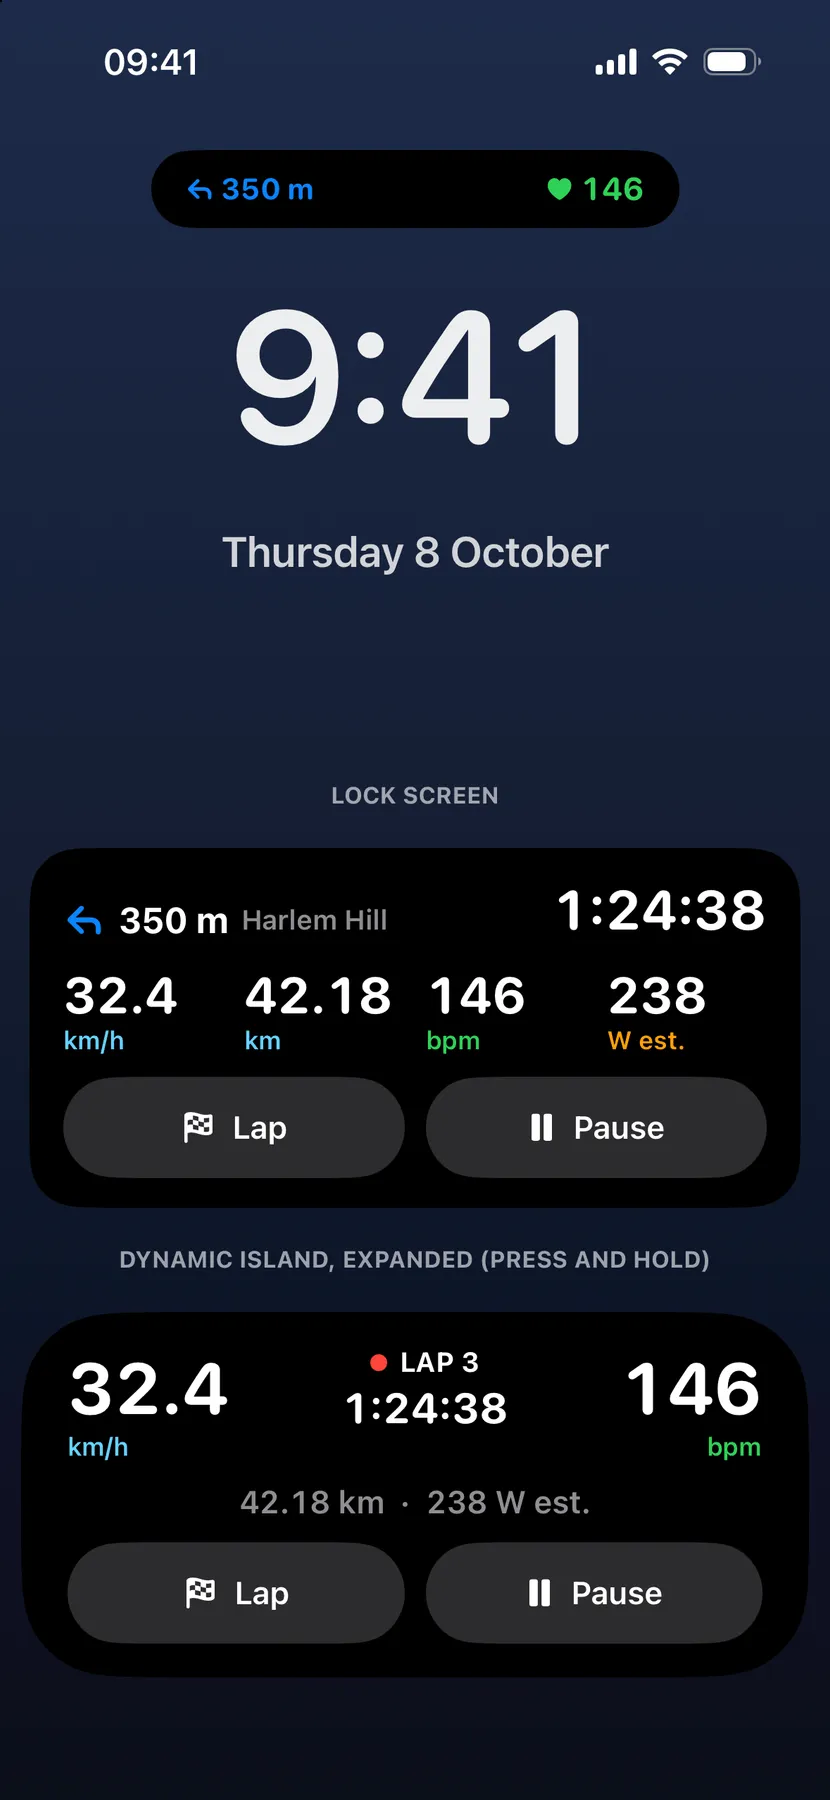
On the Lock Screen: the next turn, with Lap and Pause.
Before and after a ride
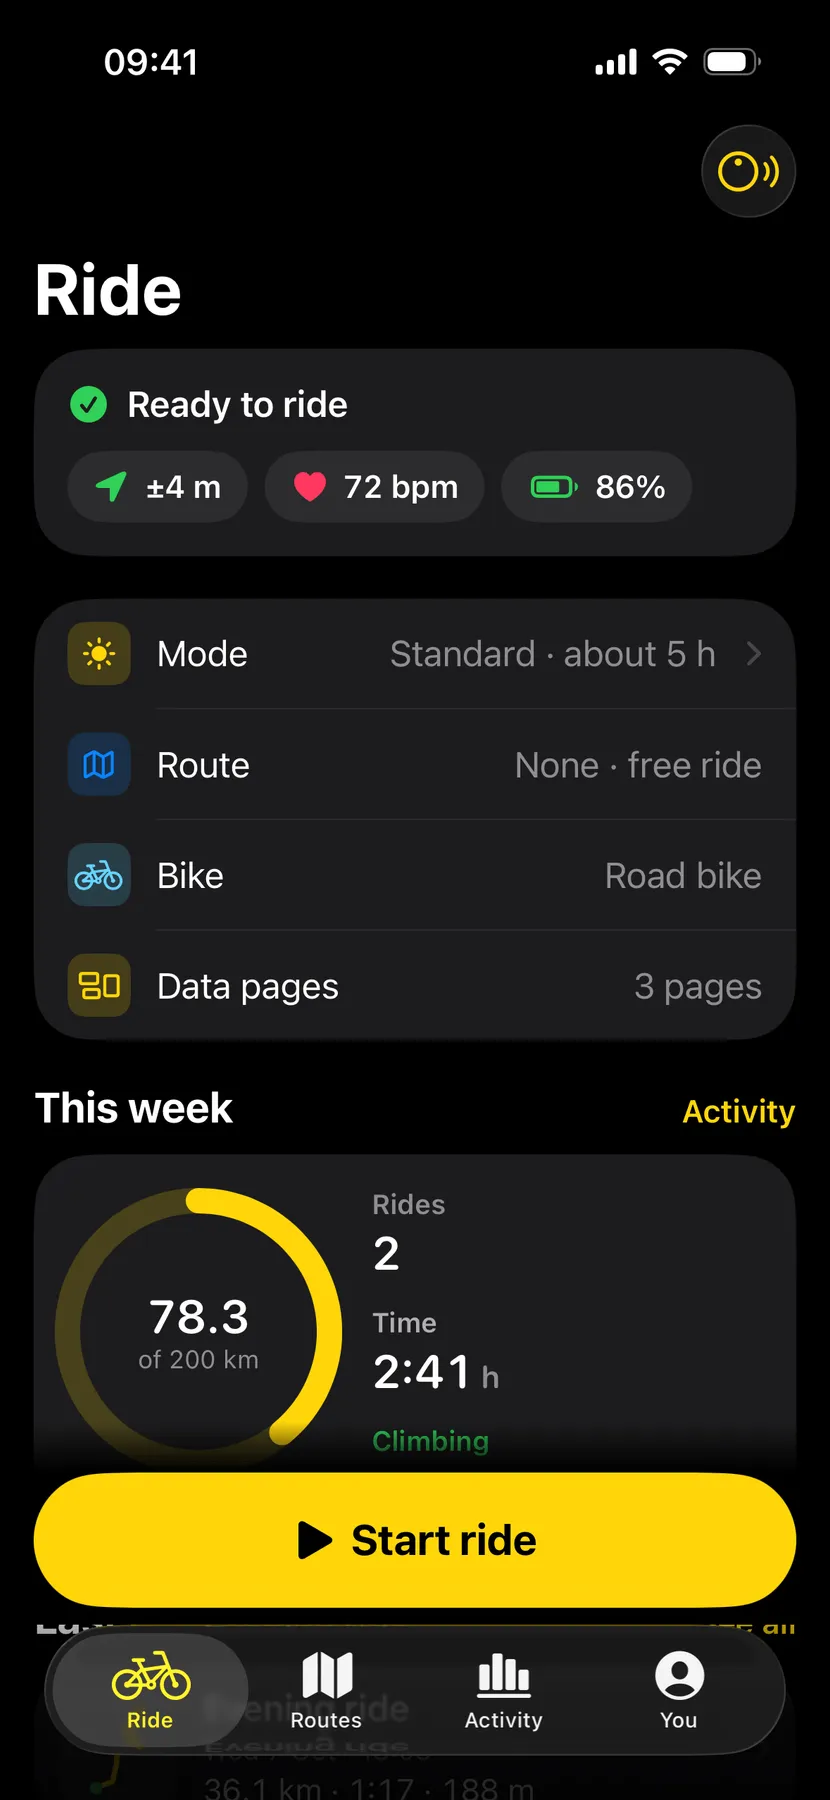
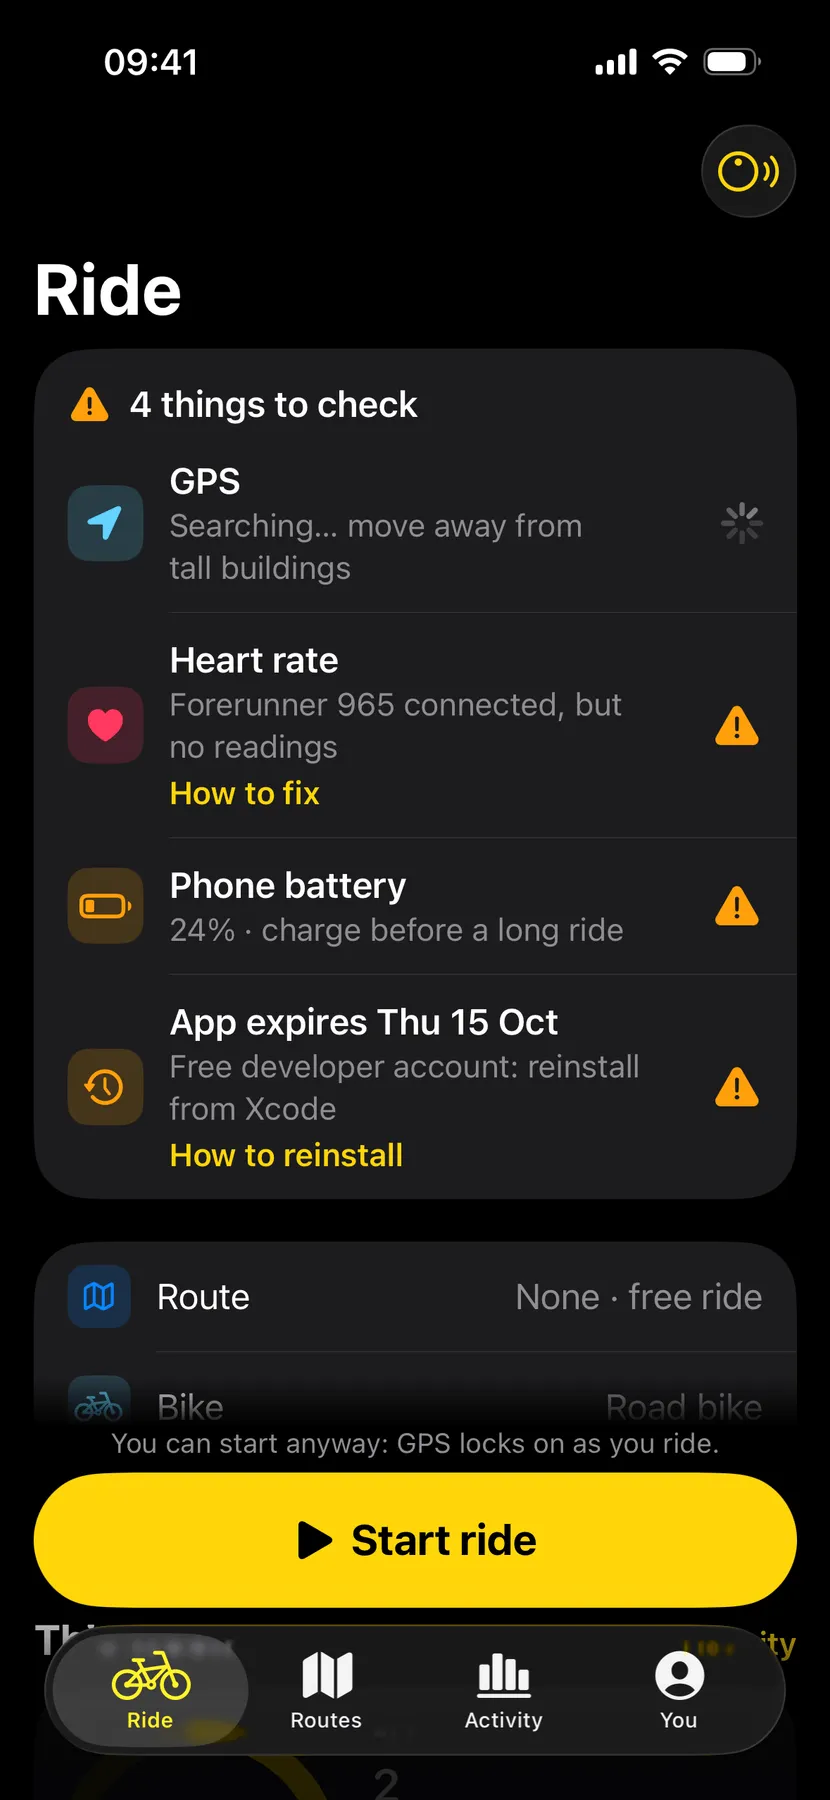
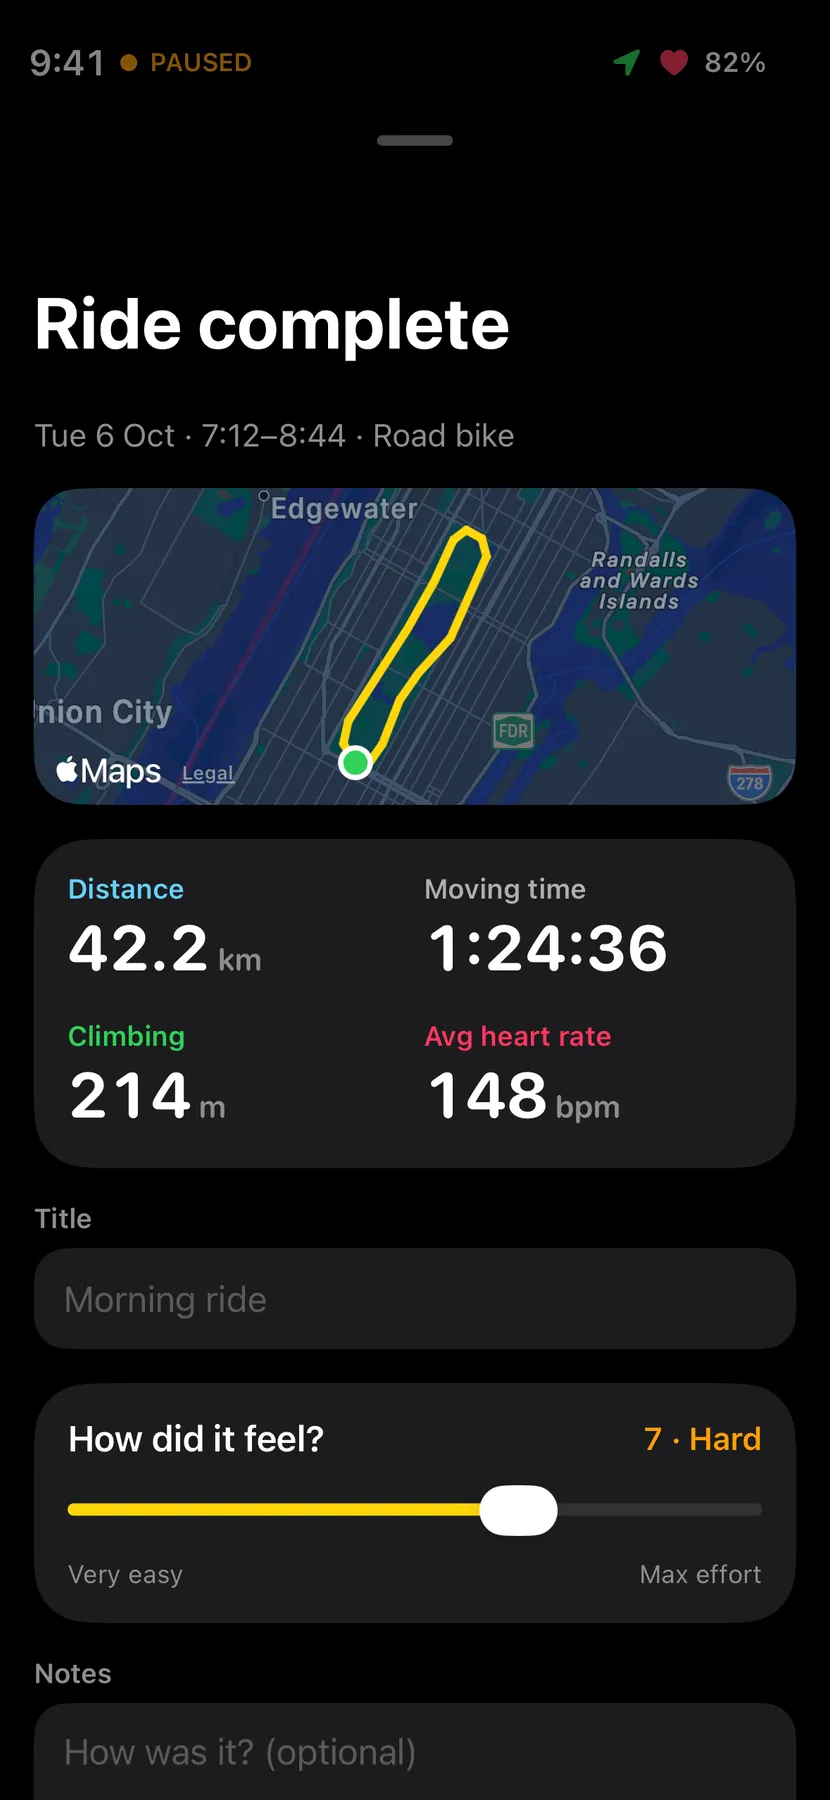
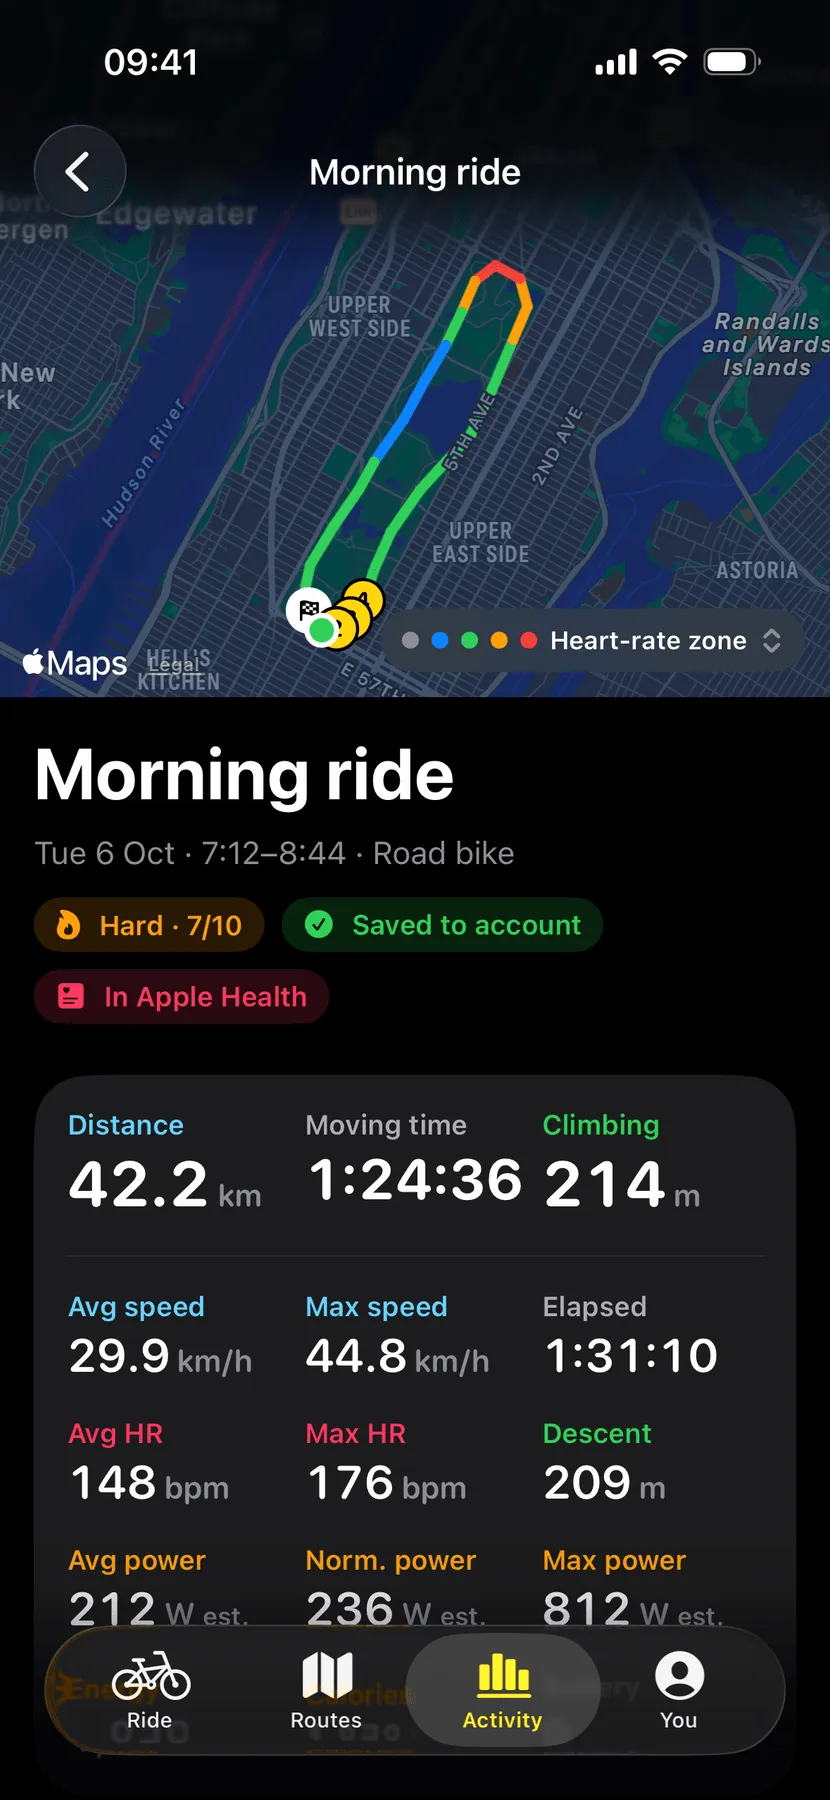
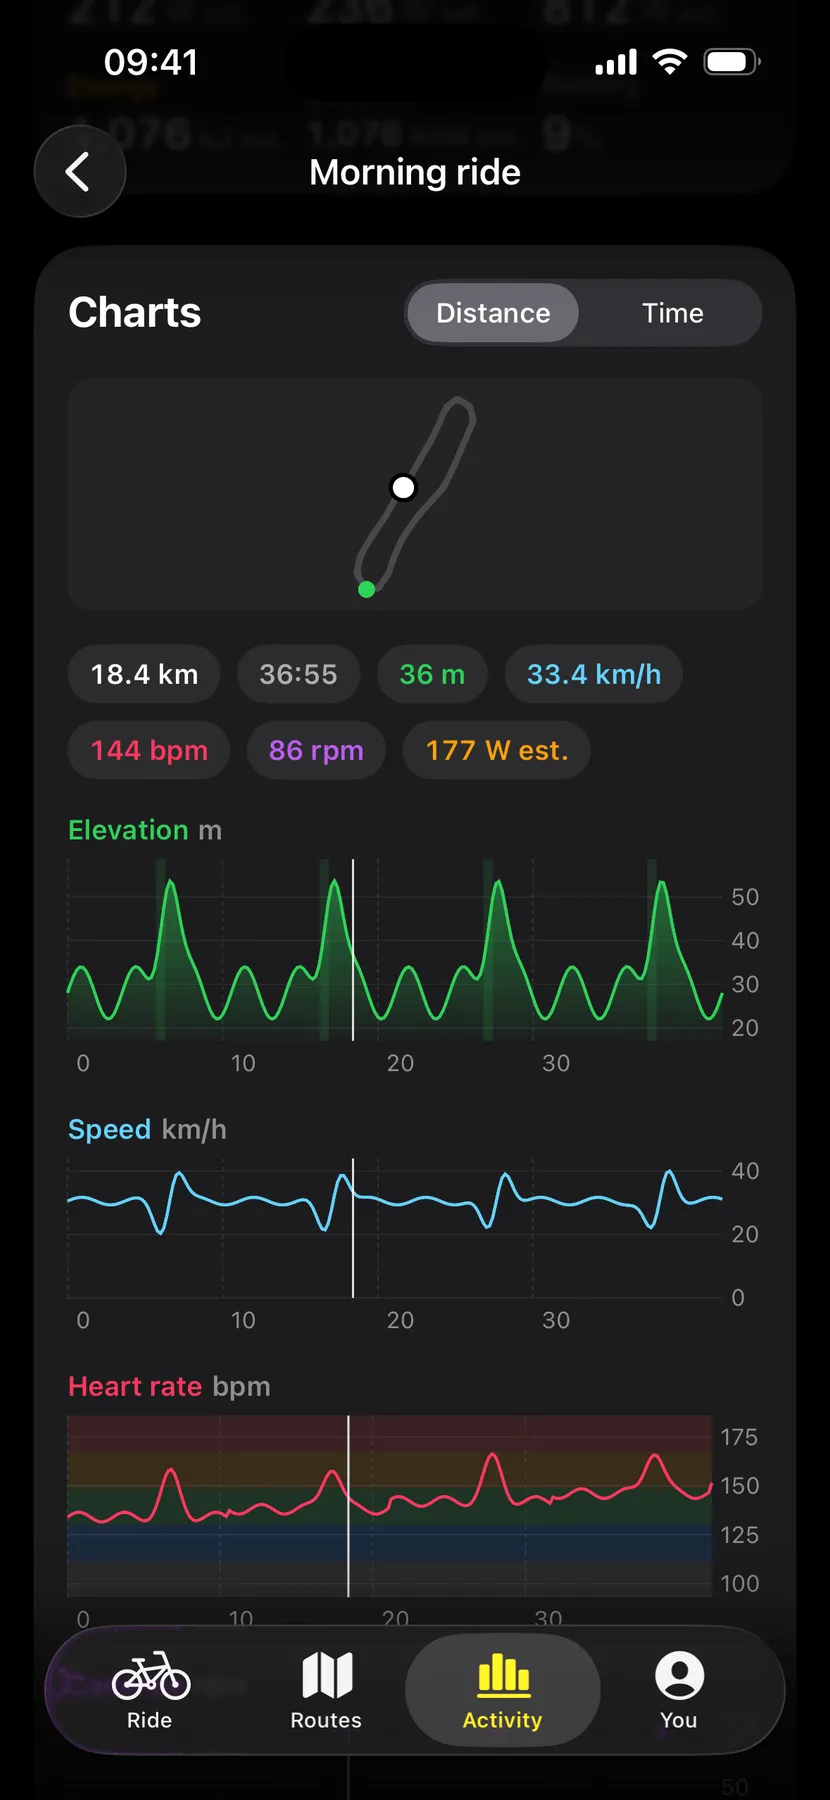
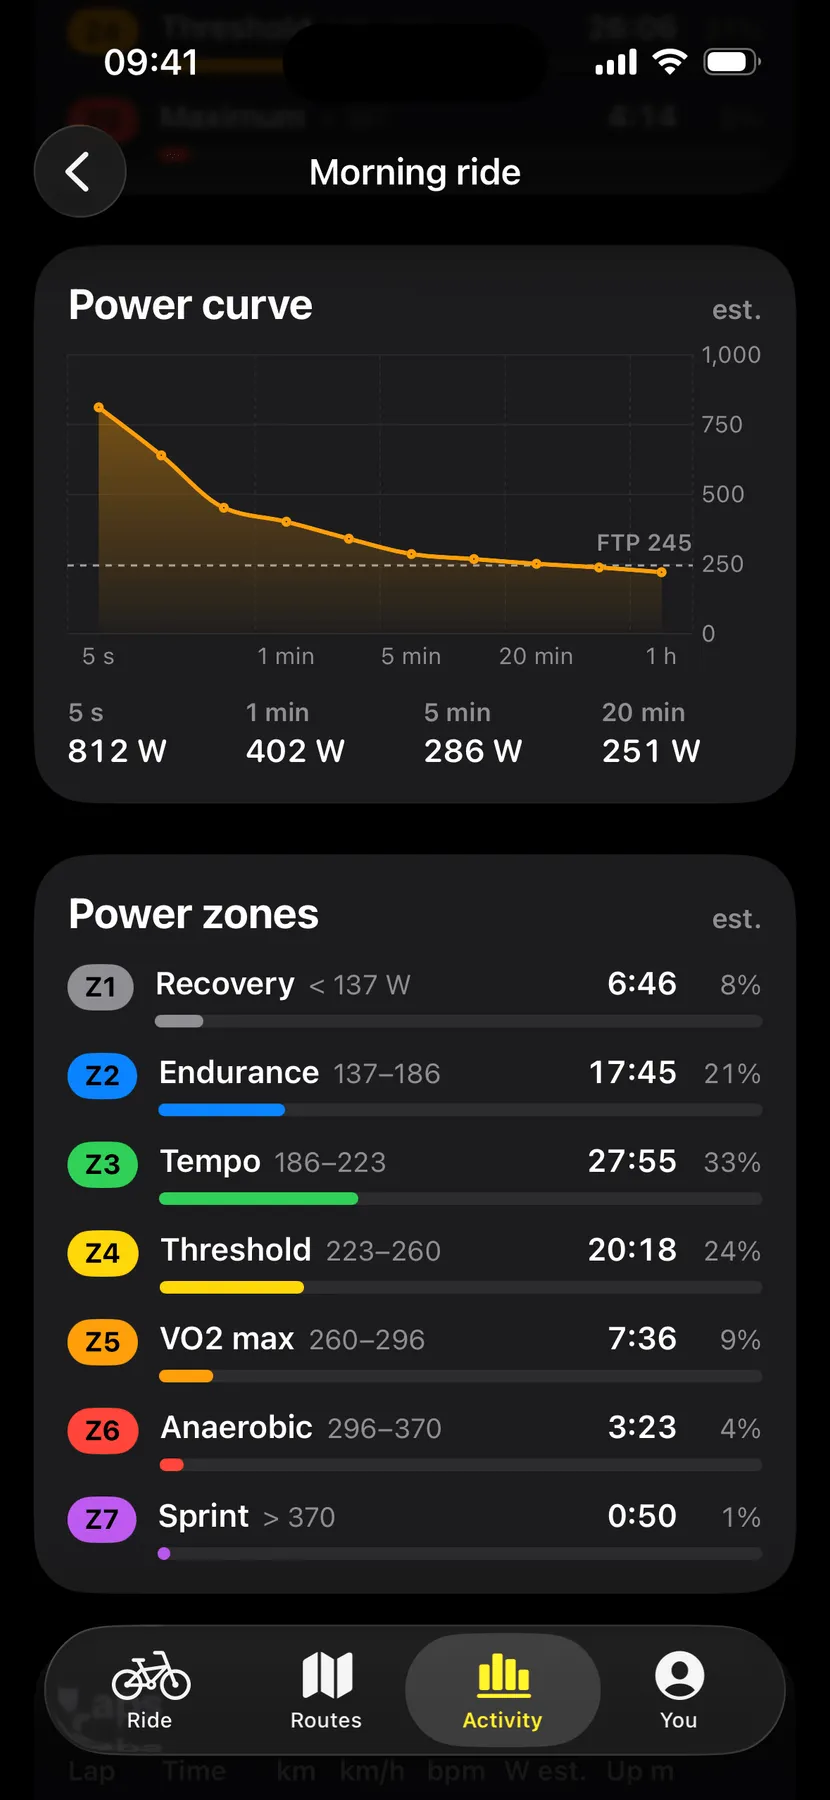
Before a ride, the Ride tab checks everything in plain language and still lets you start. Afterwards, the ride is summarised Strava-style, with the route coloured by heart-rate zone and charts linked to the map.
- (open larger image)
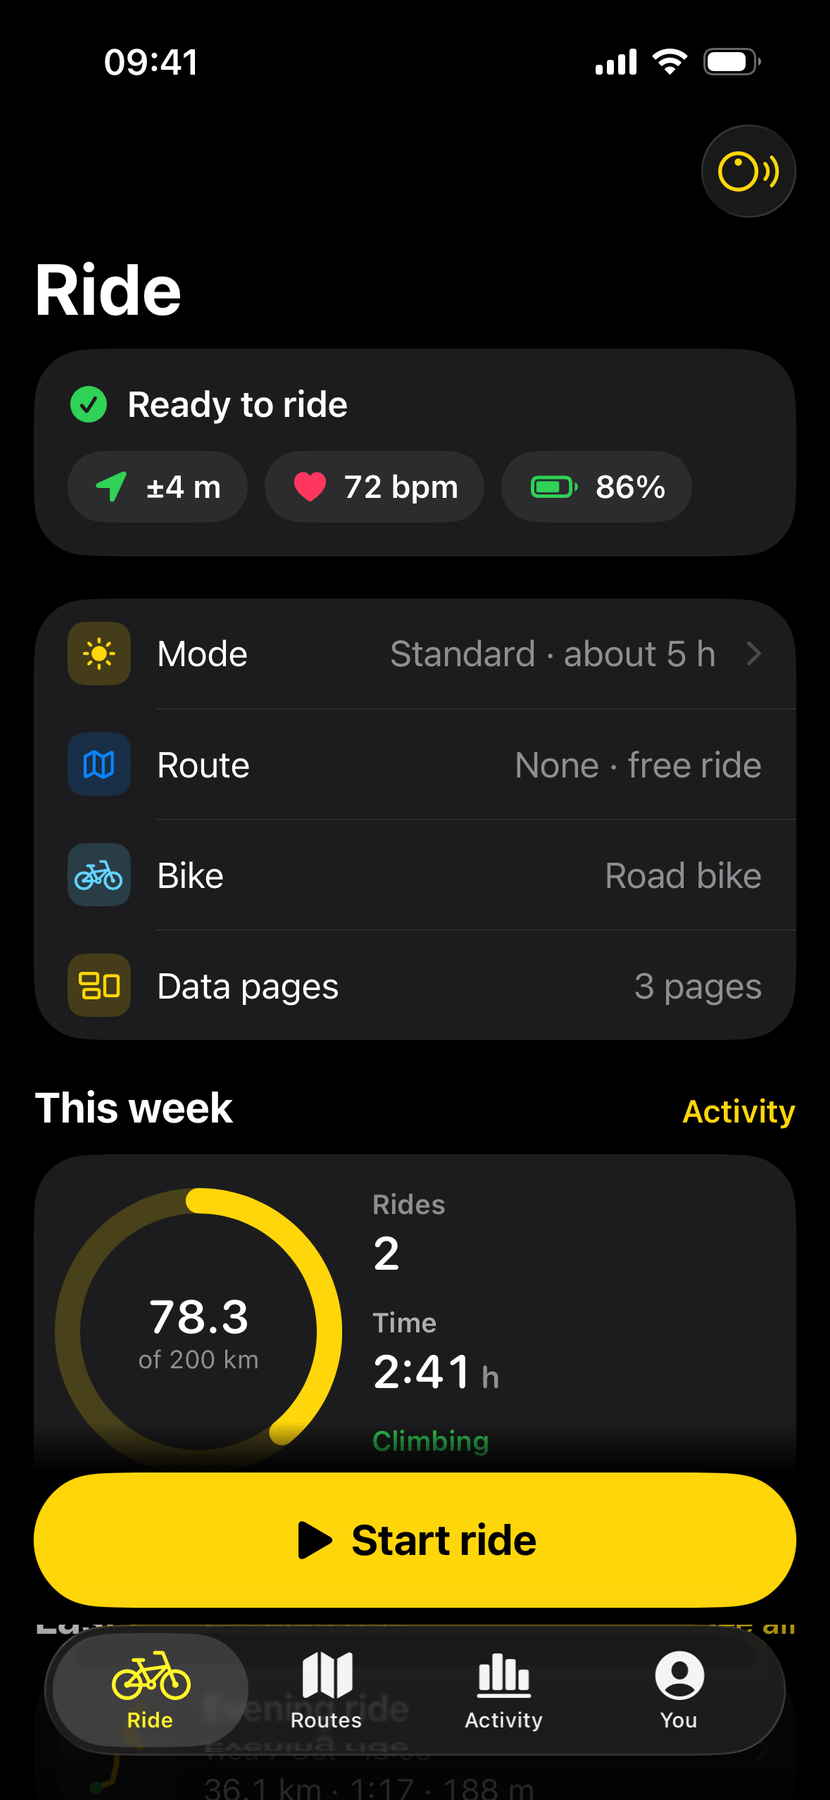
Ready: everything collapses to three chips. - (open larger image)
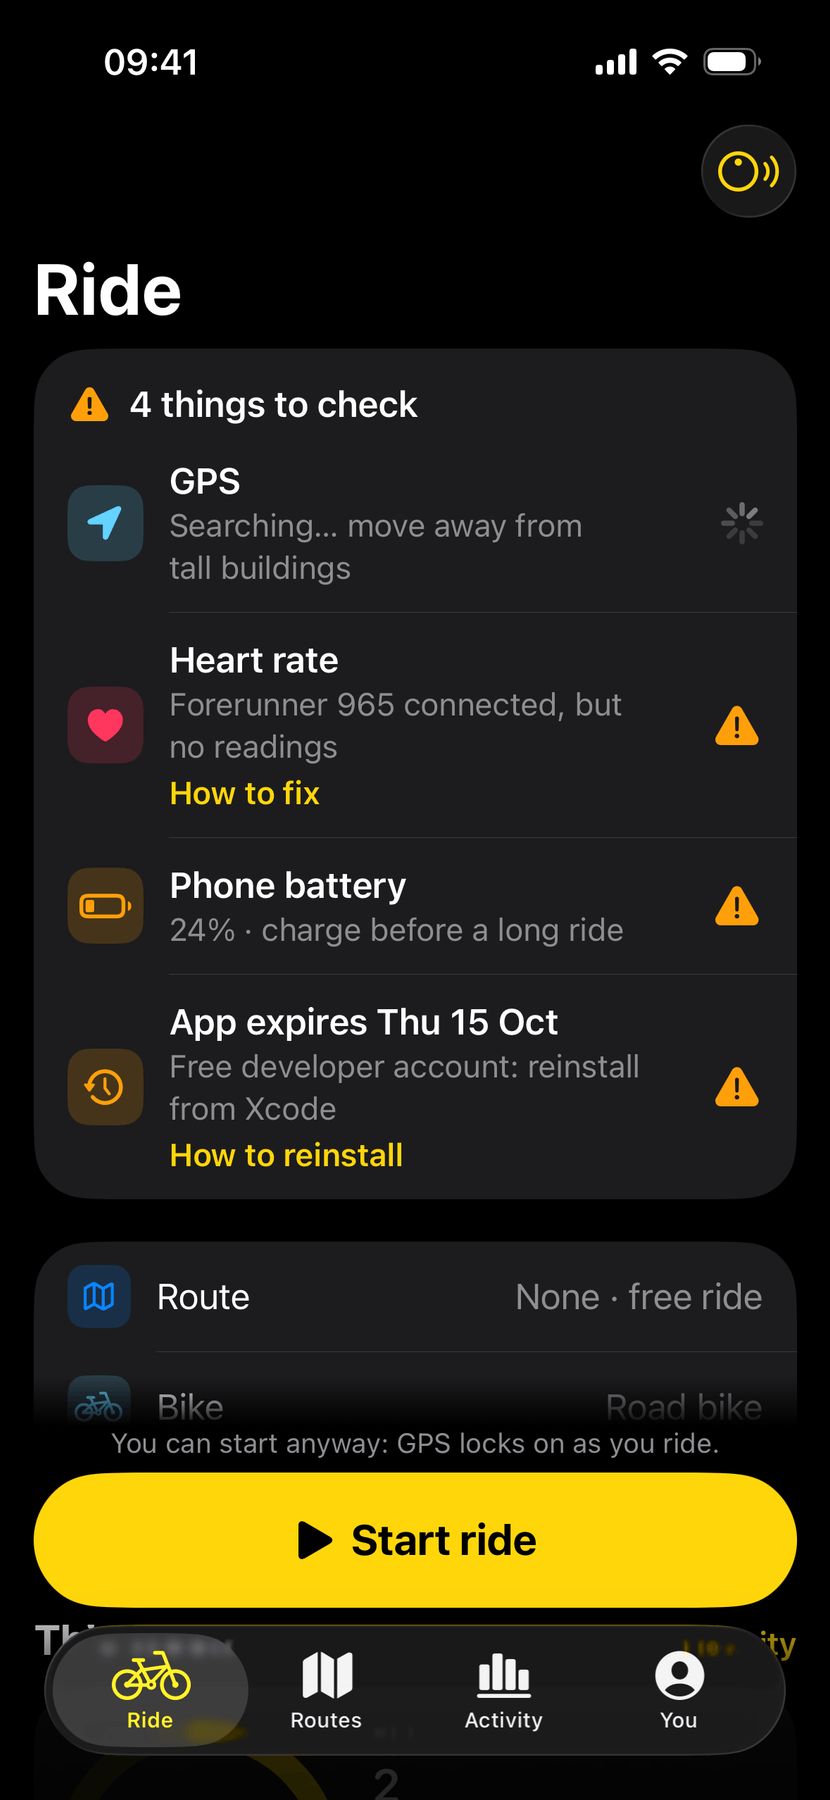
Not ready: each problem with its fix, including when this free-account build expires. - (open larger image)
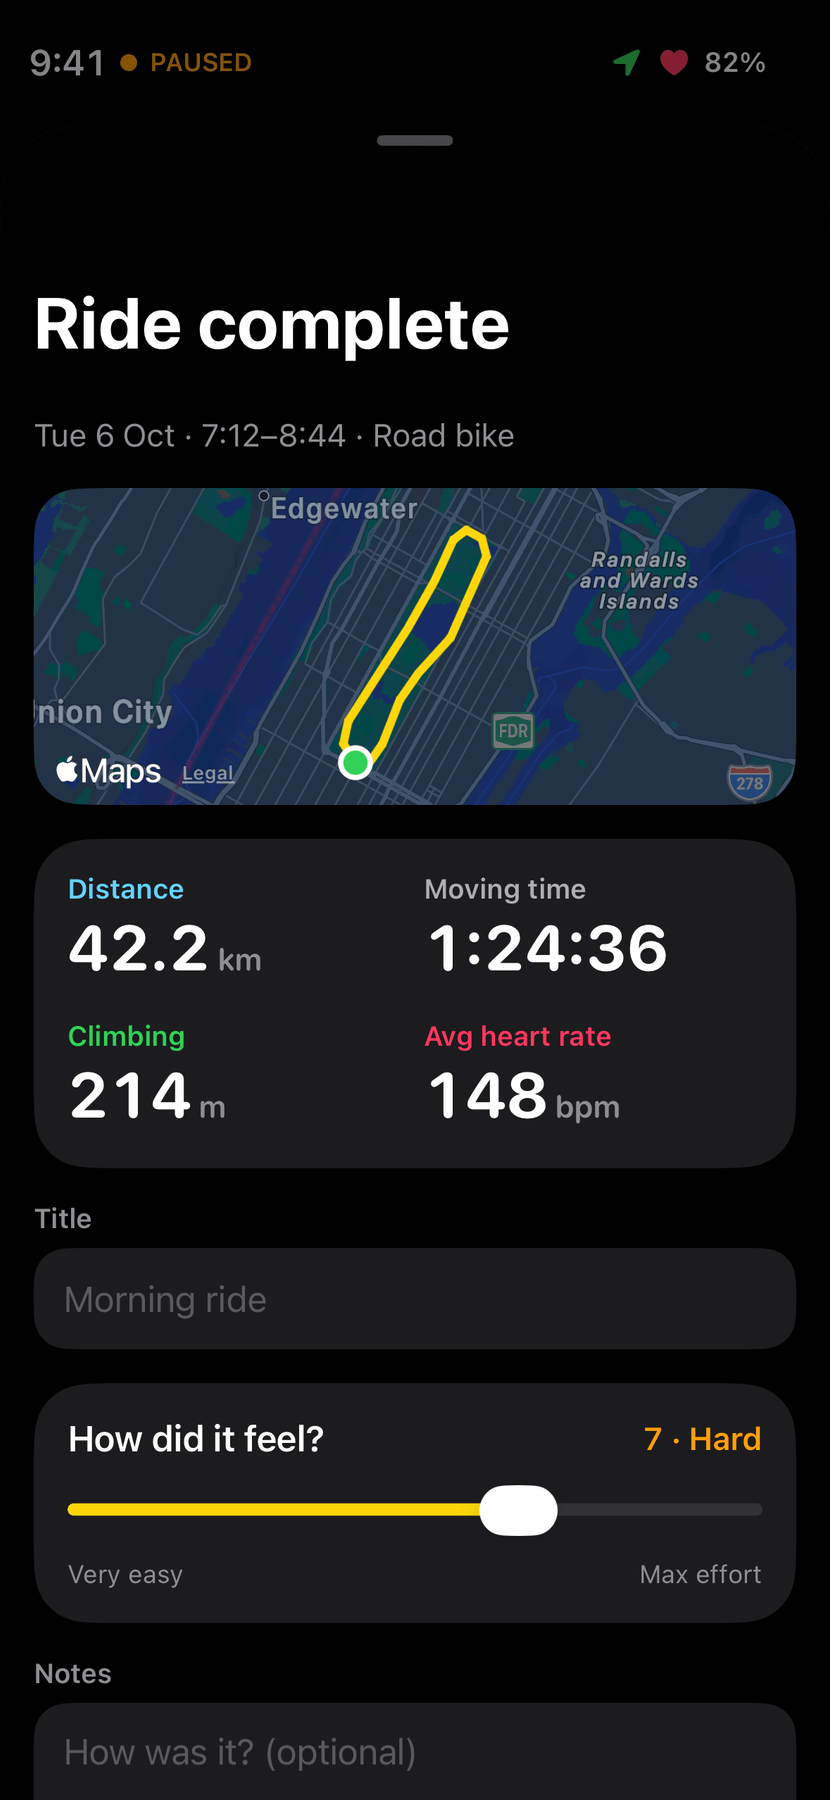
Saving: name, effort, notes and bike. - (open larger image)
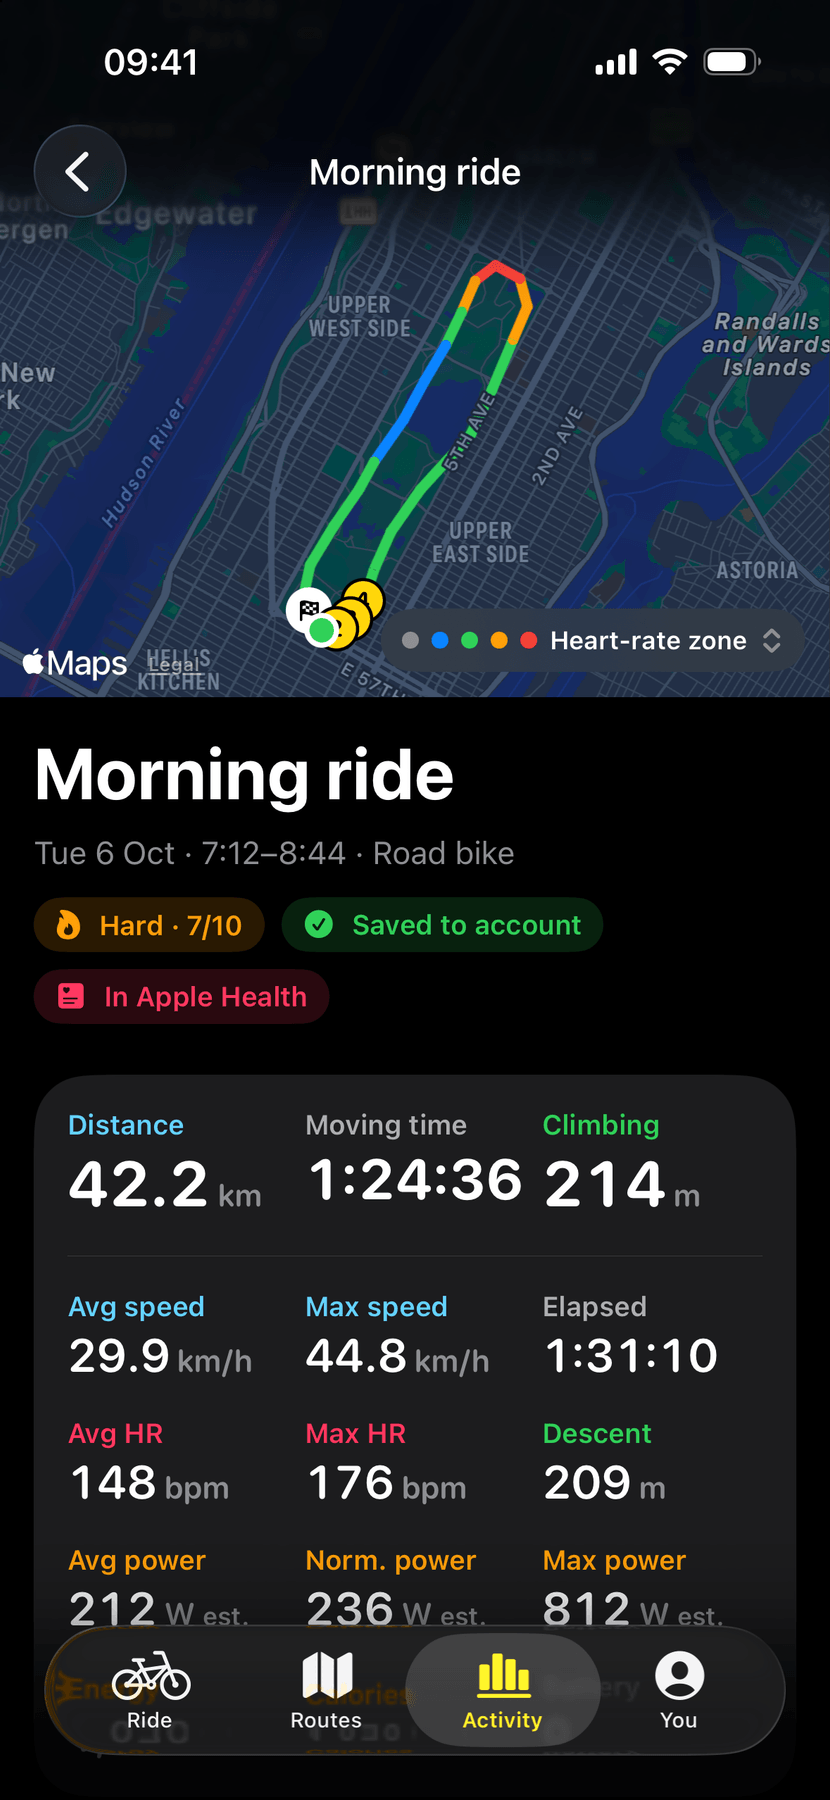
The ride, with the route coloured by heart-rate zone. - (open larger image)
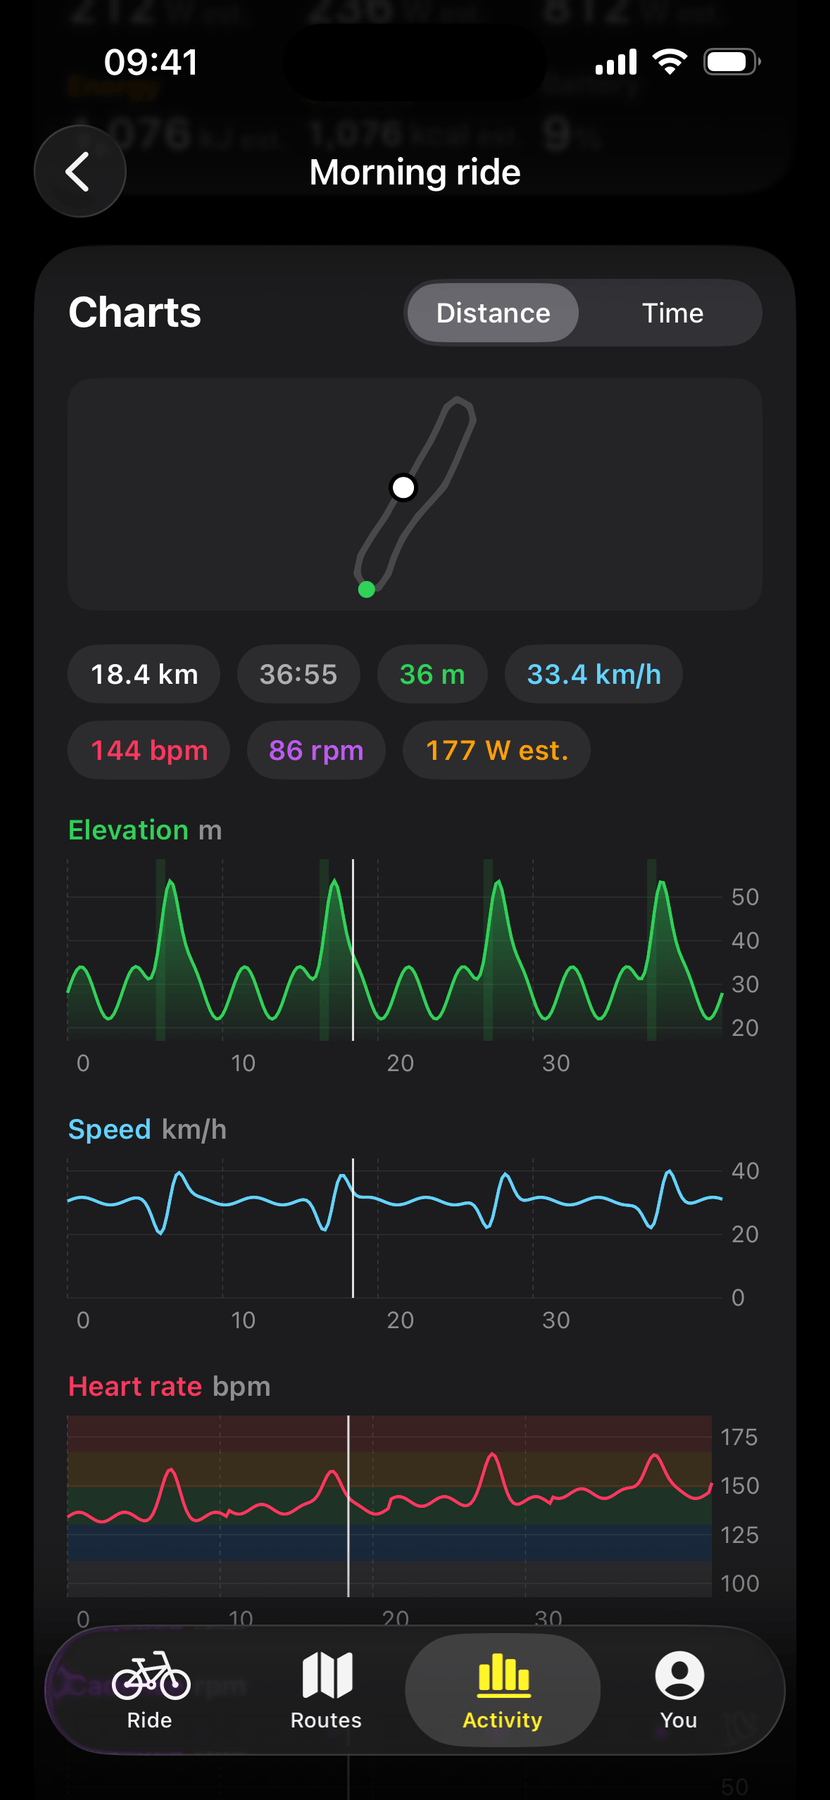
Charts that share one marker with the map. - (open larger image)
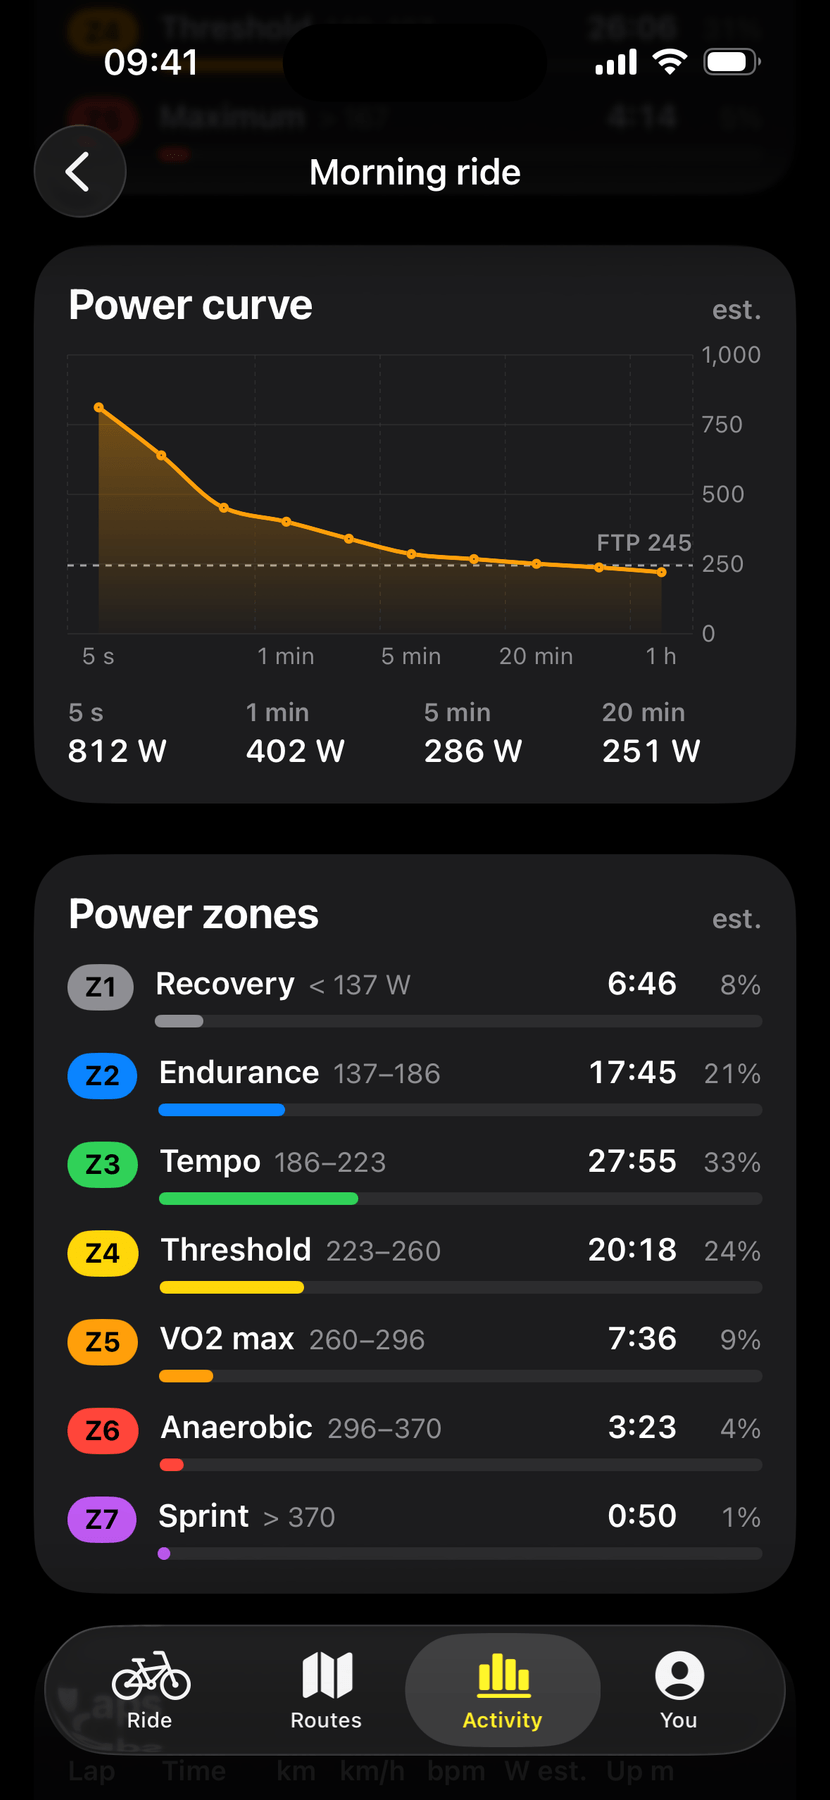
Power curve and zones, labelled as estimates.
First launch
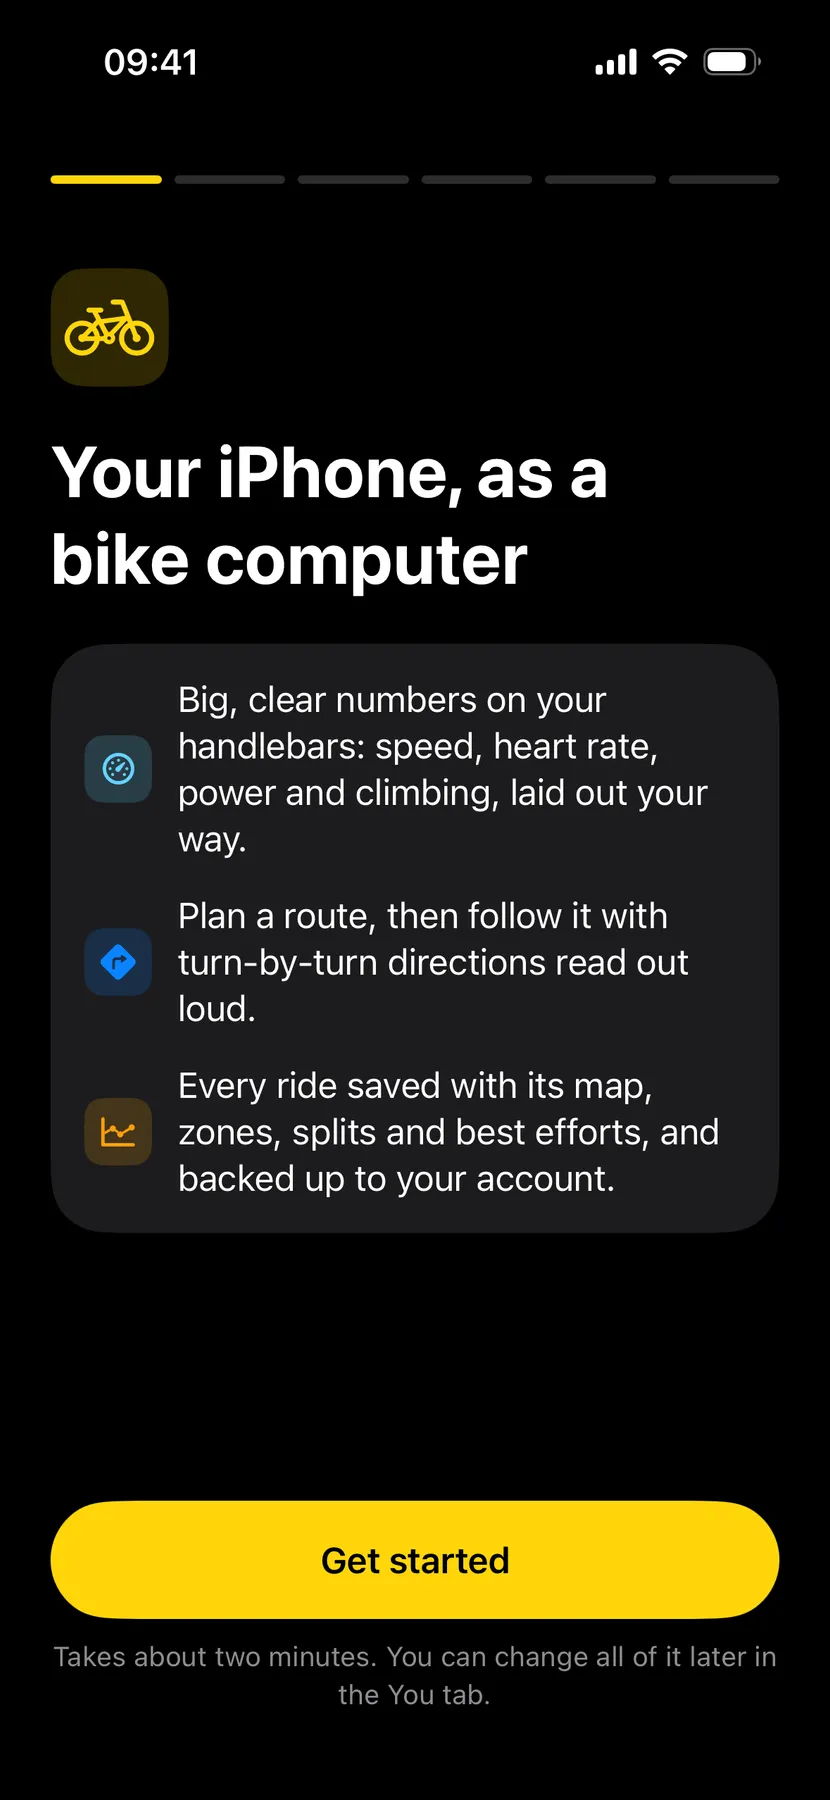
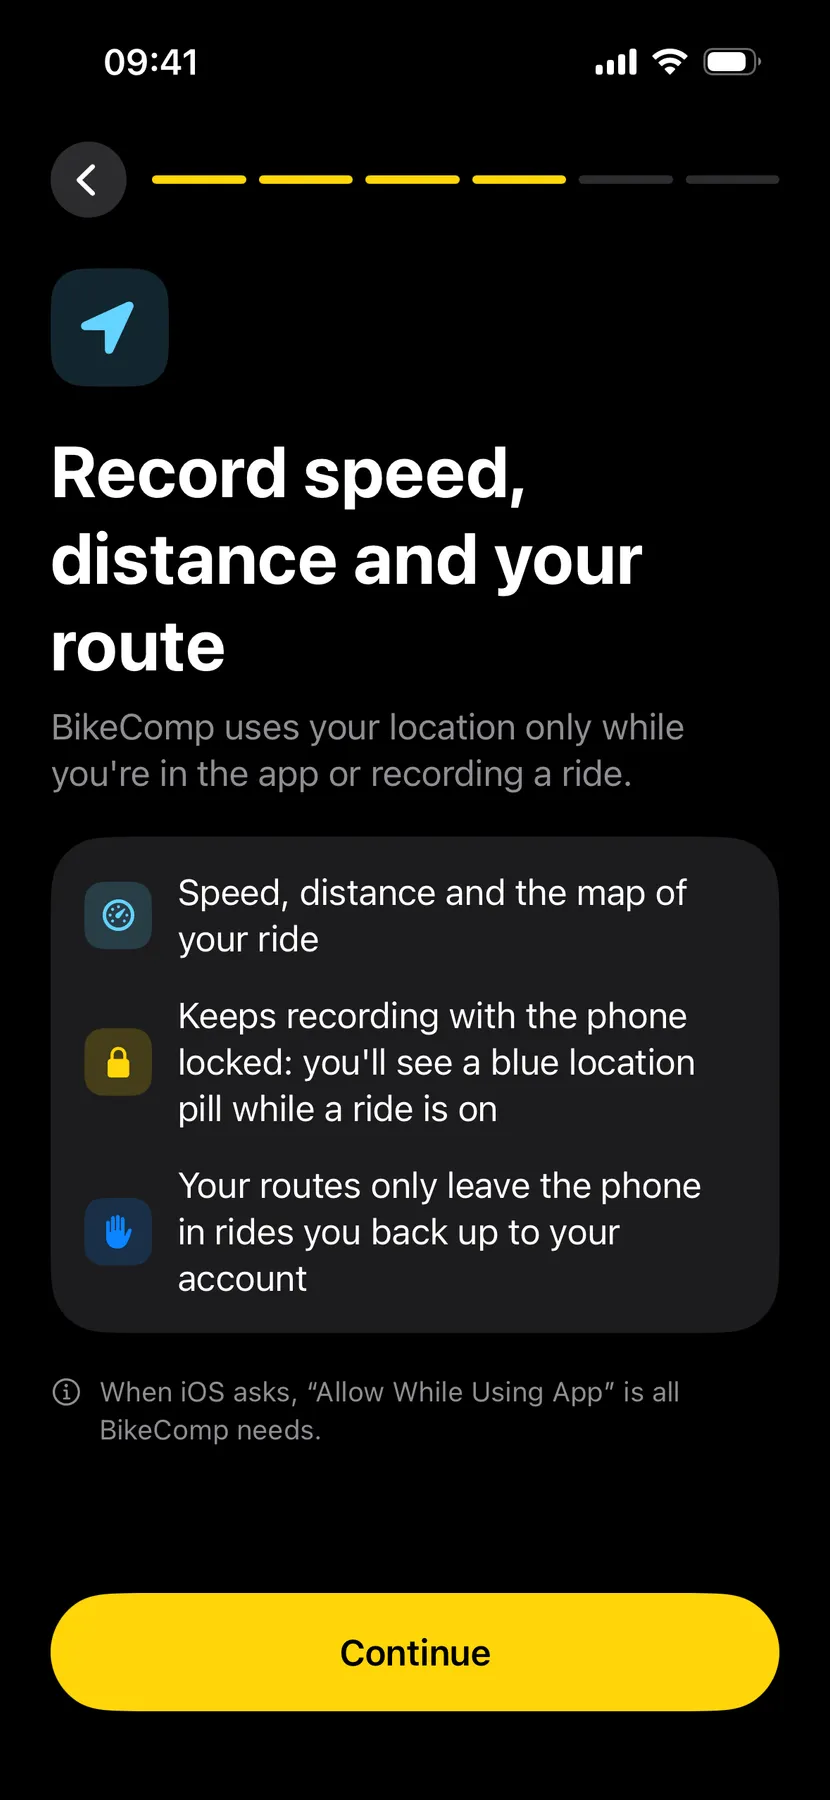
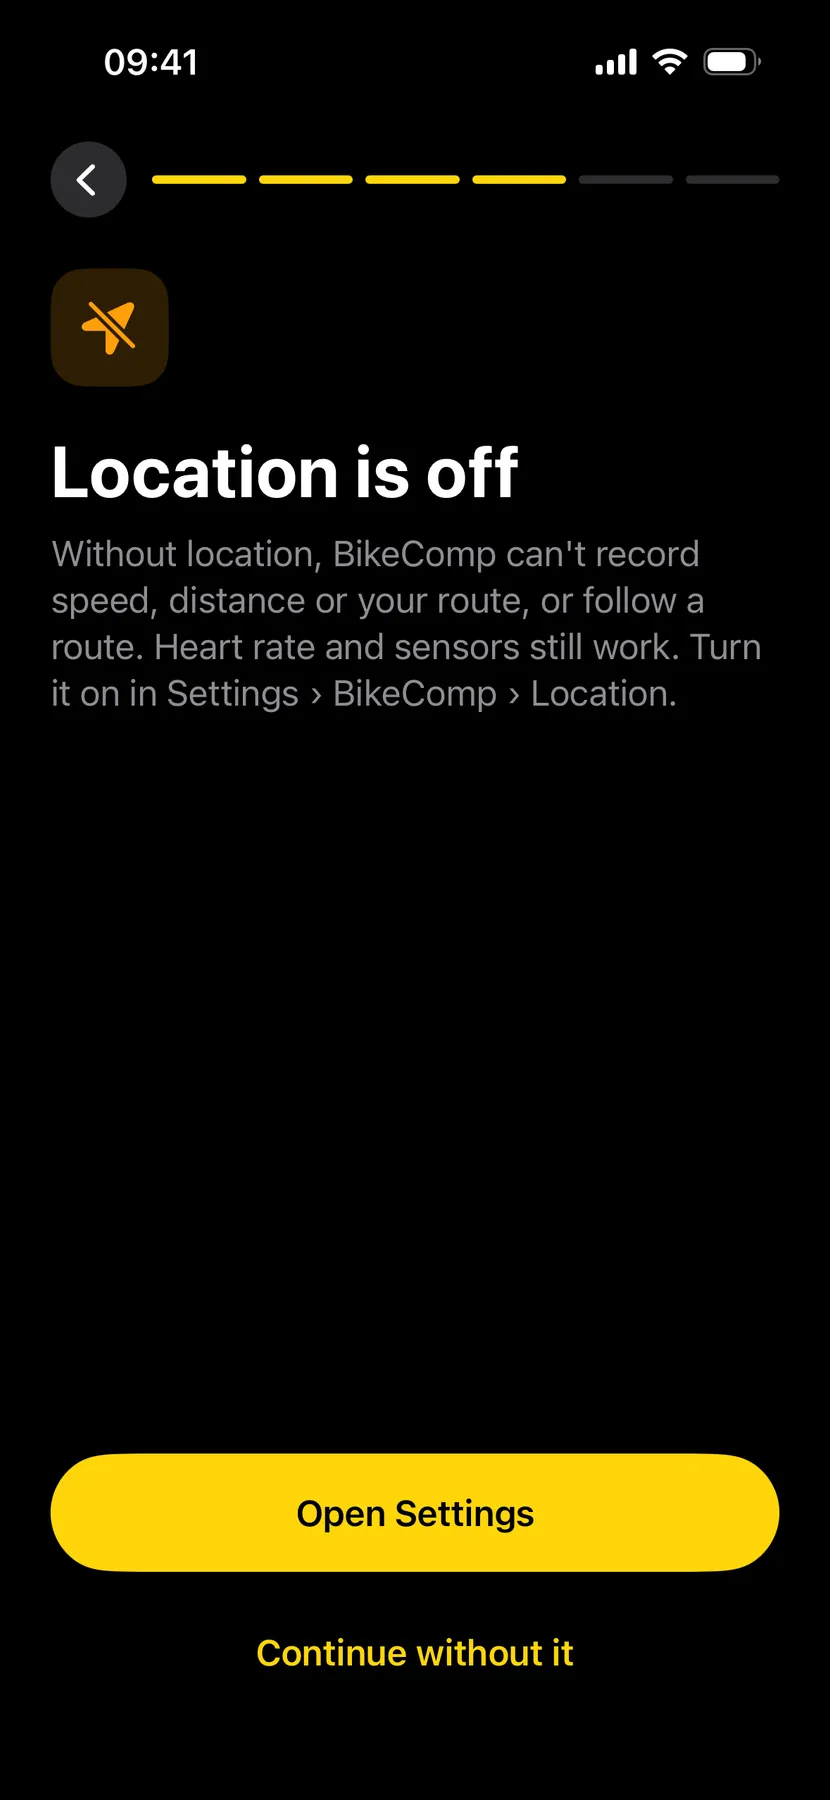
Six short steps set the app up. Each permission is explained in plain words before iOS asks for it, and saying no leads to a page that explains exactly what won’t work, with a way to Settings.
- (open larger image)
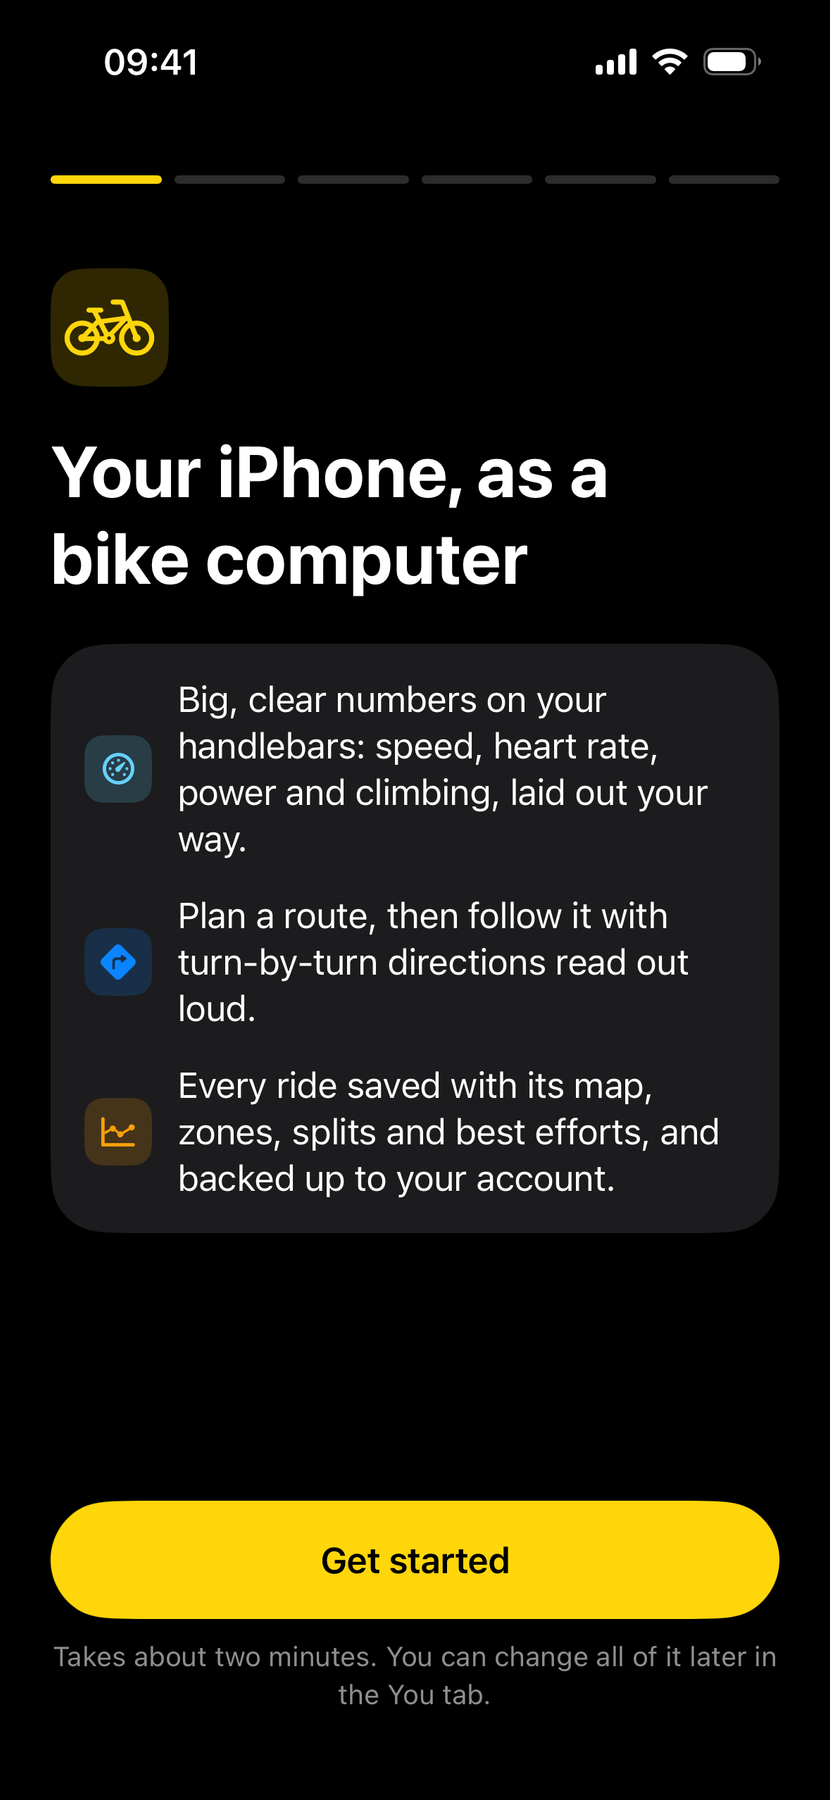
What it does, in three lines. - (open larger image)
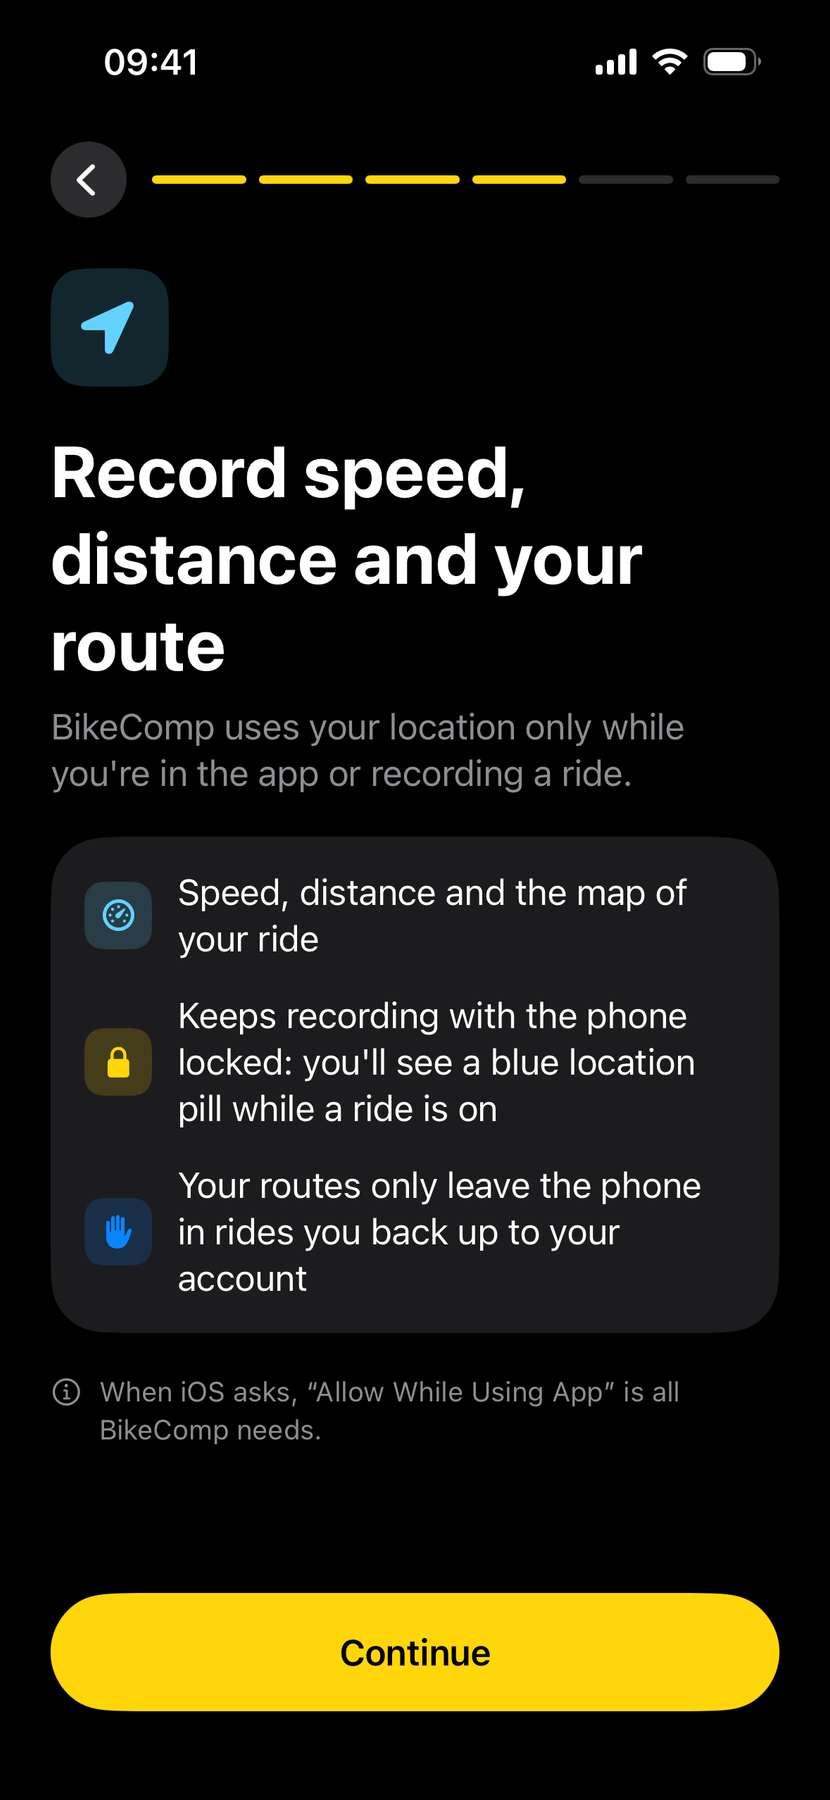
Why, before iOS asks. - (open larger image)
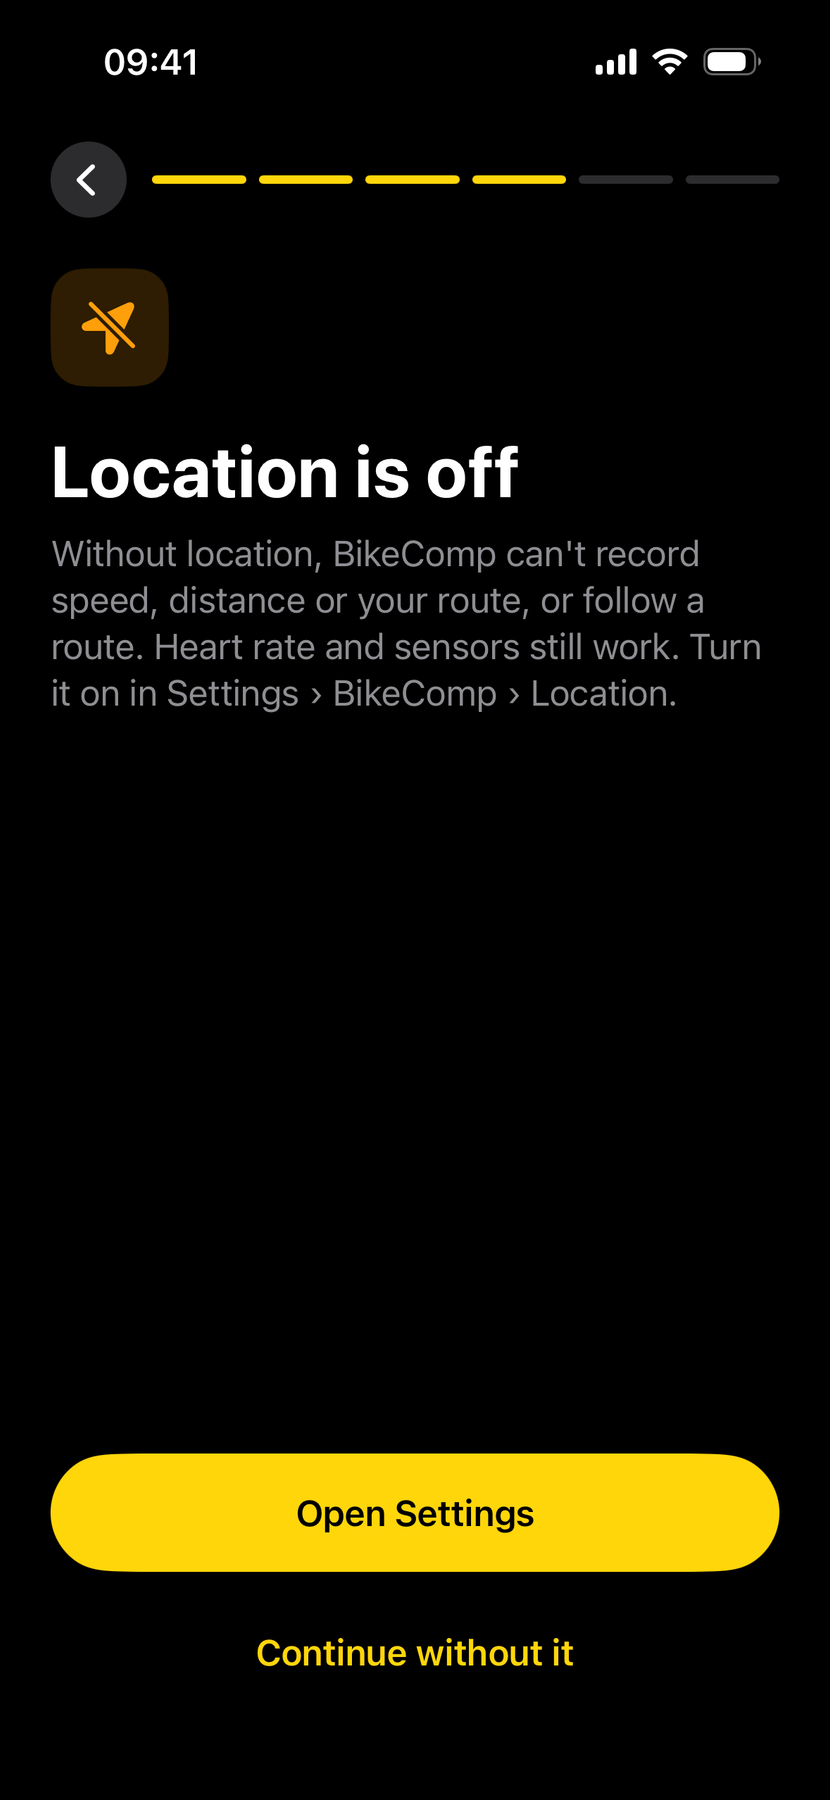
If the answer is no: what won’t work, and how to fix it. - (open larger image)
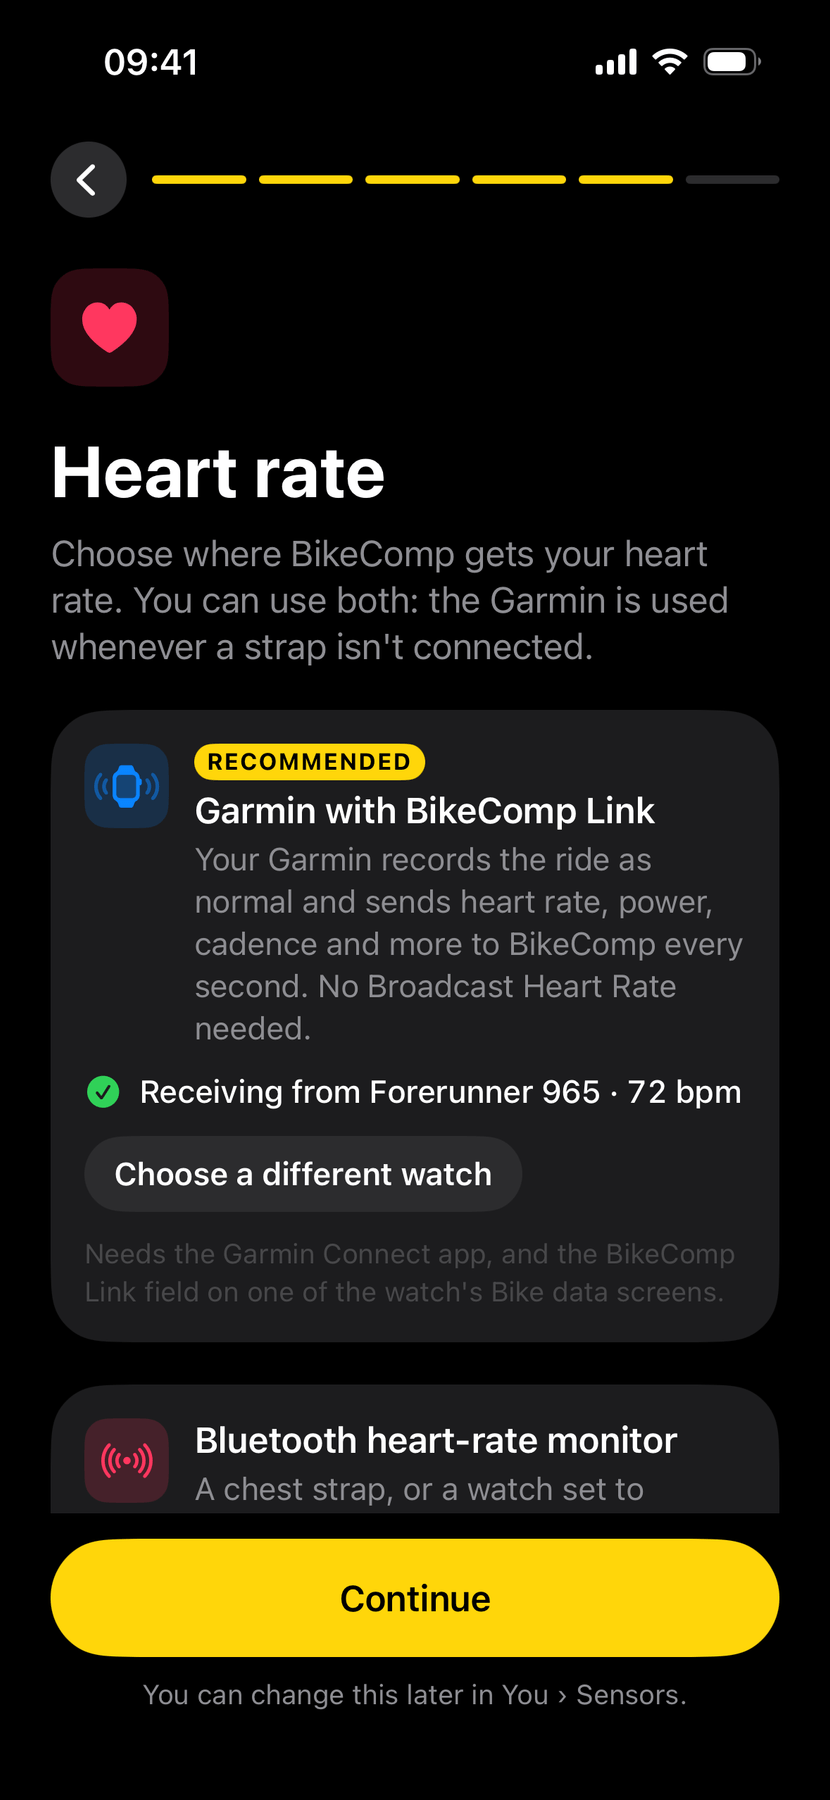
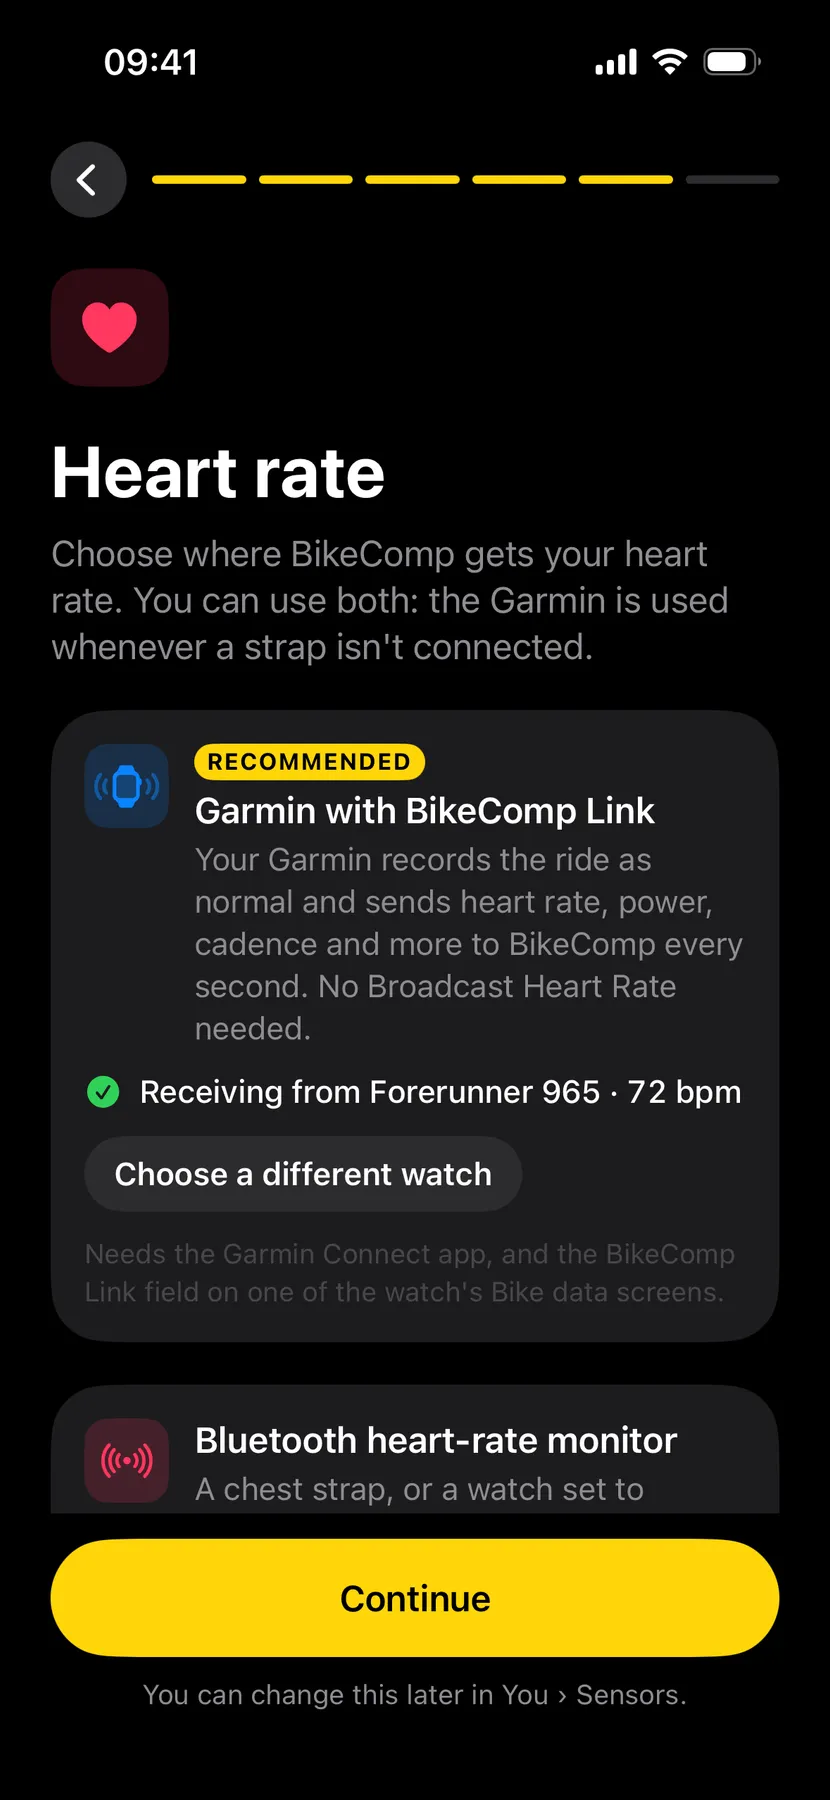
Where heart rate comes from, each with a live status.
Deliver
Eight phases
Each phase was planned, built, checked in the simulator and committed before the next began, with anything that needed me (accounts, keys, tests on the bike) saved for one list at the end.
- Heart rate: a Bluetooth link to the watch.
- Recording: GPS, the barometer for climbing, auto-pause, laps and crash recovery, then accounts on Firebase and ride export.
- Pages and power: custom pages, settings, the power estimate and the Lock Screen, then ride analysis, records and trends.
- Routes: the planner and route library, then navigation and GPX import.
- Music: Apple Music and Spotify.
- The Garmin link: a data field on the watch and a bridge on the phone.
- Apple Health and polish: Health, onboarding and a battery review.
- Ride modes, earbuds, devices and offline maps: decided from research into what else the app could use.
The phone and the watch, together
I wanted to keep recording my rides on the Garmin as normal. The usual way to share a watch’s heart rate means switching its phone link off, so instead BikeComp Link, a small Garmin data field, runs inside the watch’s own Bike activity. Once a second it sends the phone heart rate, power, cadence, speed and distance, plus things only the watch knows: Training Effect, Body Battery, stress, breathing rate and Shimano Di2 gears.
On the Garmin
- The Bike activityRecords the ride as usual
- BikeComp LinkA data field that sends the watch’s numbers once a second
On the iPhone
- Best source per numberBluetooth sensors first, then the watch; never an average
- Filling GPS gapsWhen the phone’s GPS drops out, the watch’s distance and speed carry on
- A distance cross-checkThe ride notes how closely the phone and watch agreed
- GPS from the GarminIn the saving modes the watch's position stands in, so the phone's GPS can rest
After the ride
- Apple HealthAn outdoor cycling workout with the route
- My accountBacked up to Firebase
- ExportGPX and TCX files, without estimated power
Each number comes from its best source rather than an average of two devices: averaging a good reading with a worse one only makes it worse. When the phone and watch both measure distance, the ride’s data-quality note says how closely they agreed, and warns when they differ by more than 3%.
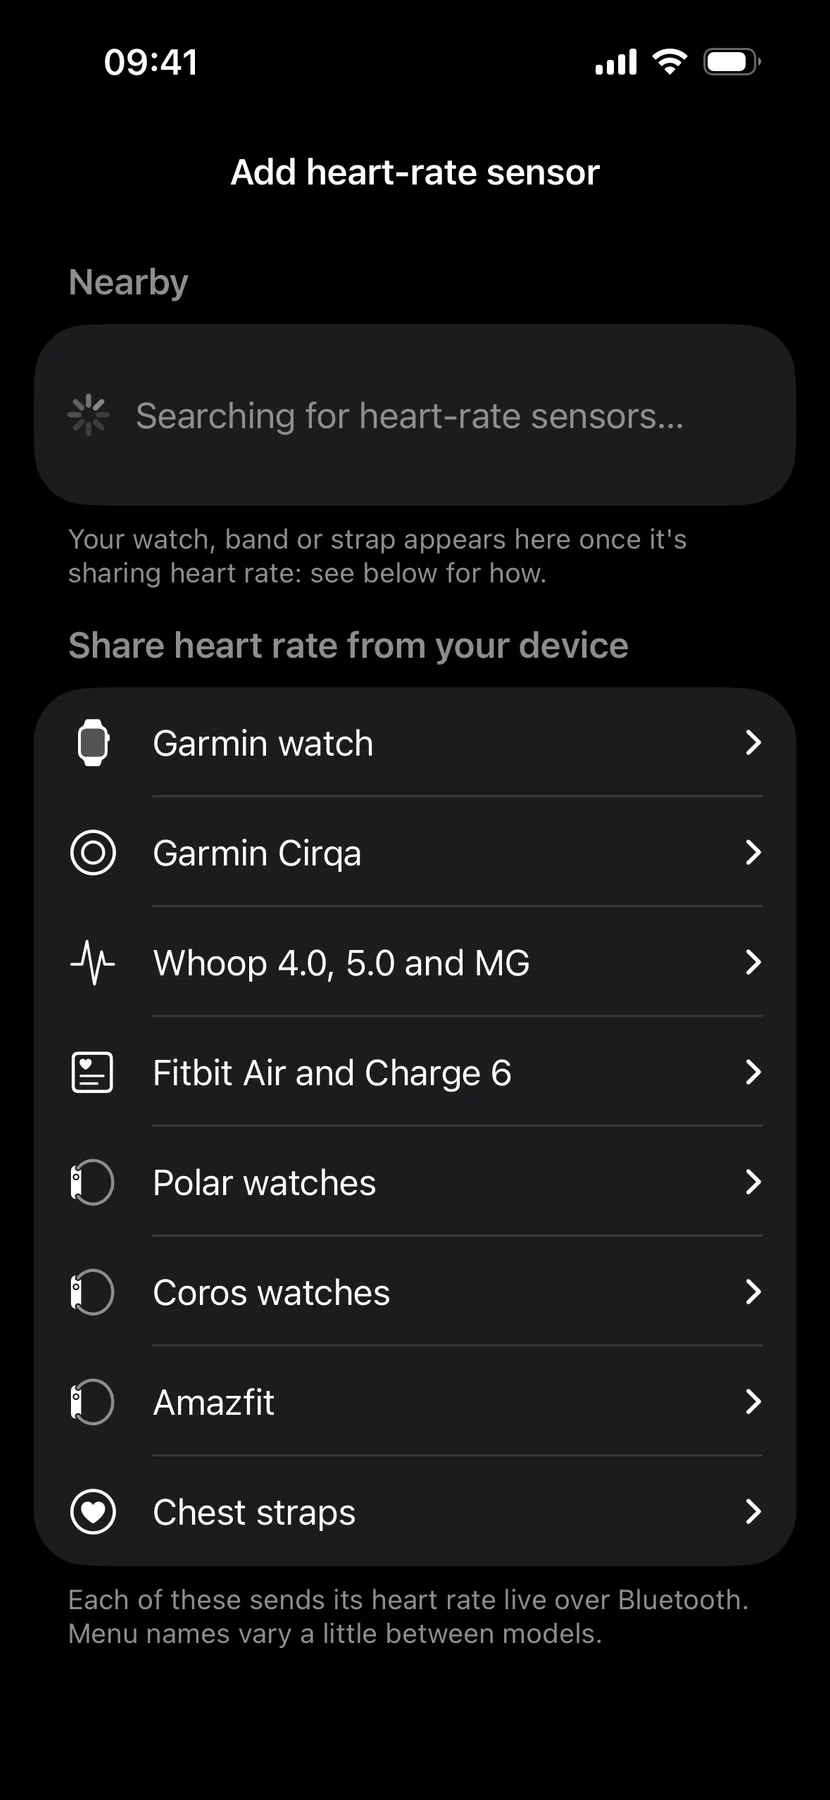
Heart rate comes from a strap if I pair one, then the Garmin, then earbuds that measure it (AirPods Pro 3 and Powerbeats Pro 2, read live through Apple Health from iOS 26). BikeComp Link now builds for 75 Garmin models, and bands like Garmin Cirqa, Whoop and Fitbit Air can share live heart rate over Bluetooth, which the pairing screen explains for each.
- (open larger image)
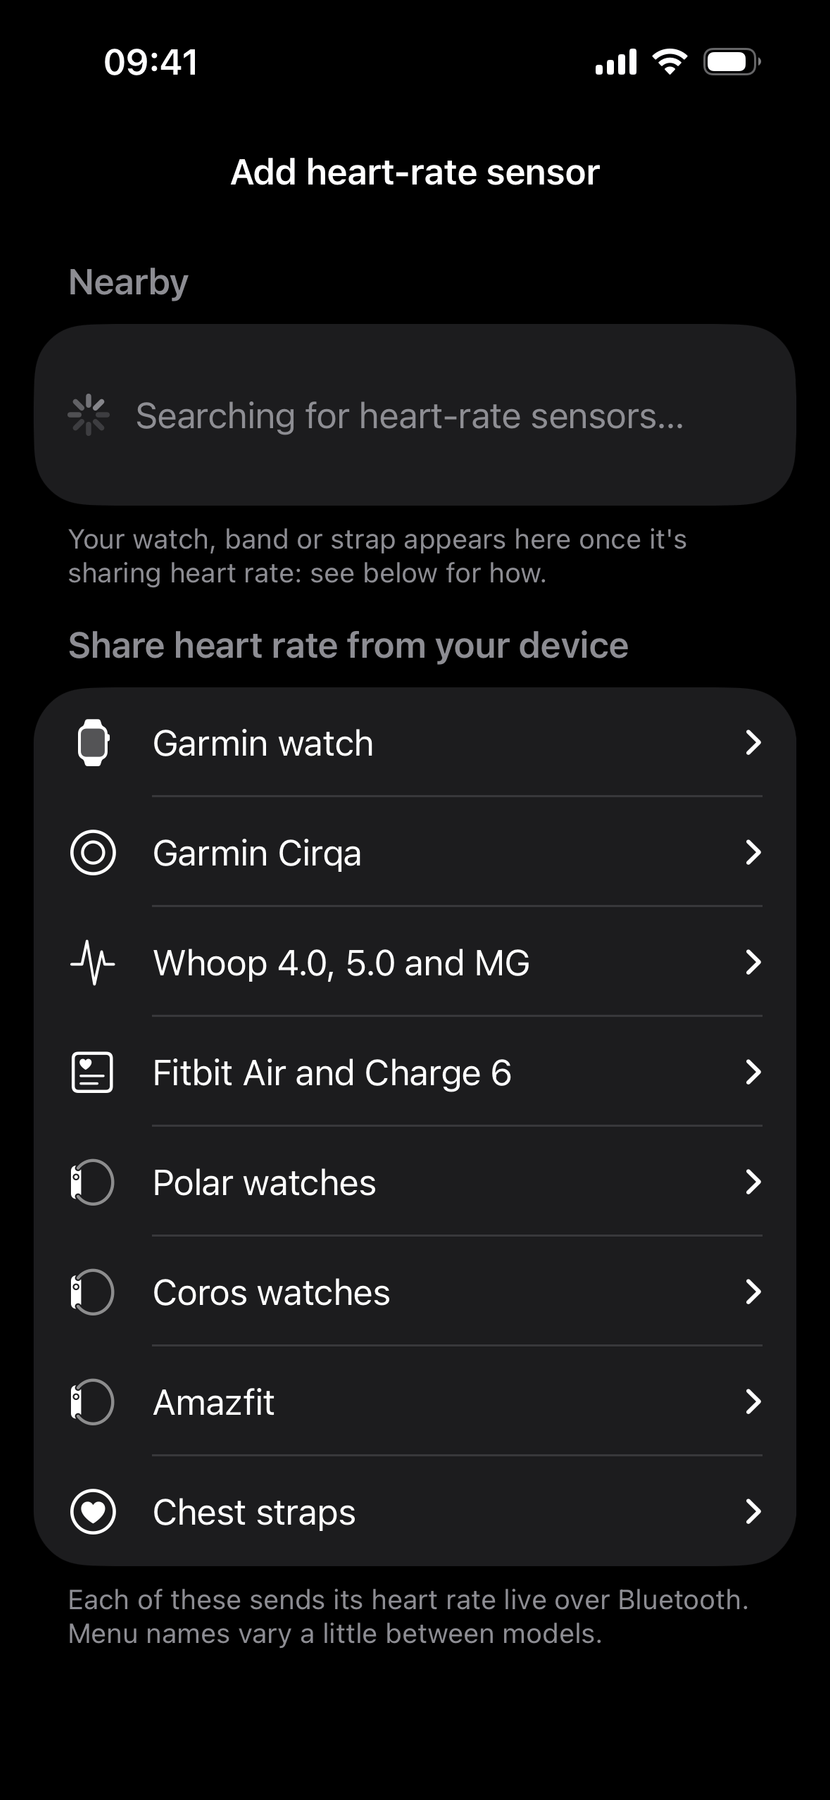
Set-up steps for each kind of wearable, where you pair it.
I also asked whether cadence could come from the phone’s and watch’s motion sensors. The research said no for the watch, as a Garmin data field can’t read raw motion, and only a rough guess for the phone on the bars, so a cadence sensor is the honest answer.
Honest numbers
Without a power meter, power comes from a physics model using speed, gradient, my weight and the bike’s tyres and riding position. It’s always marked est., and it’s left out of the exported files and Apple Health, where it would look like a real measurement. Lost GPS or a dropped sensor shows as a gap, and every ride ends with a plain note on its data: how long GPS was missing, whether heart rate dropped out, and where power came from.
Battery
A battery review found a hidden cost: during a ride, the tabs underneath the ride screen were redrawing about once a second, rebuilding every ride’s statistics each time. Measured in the simulator, they redrew 26 times in 25 seconds of riding. After the fix they don’t redraw at all until the ride ends, and the pre-ride checks refresh every five seconds instead of on every GPS update. The rest of the battery rules were in the spec from the start: true black, once-a-second updates, GPS switched off during long stops, and a battery report after every ride. The ride modes then put the choice in my hands, and every ride saves its mode and battery use, so the estimates become my own.
Testing
- 133 automated tests, covering the power estimate, sensor data, route matching, the phone-and-watch distance maths, battery estimates, the GPS hand-over and turn wakes, exports and Apple Health.
- Simulated rides with fake GPS around Central Park: recording, auto-pause, navigation, the Lock Screen and saving.
- Every screen photographed in the simulator at the iPhone 16’s size, and reviewed on one page.
- The Garmin field on eight models in Garmin’s simulator. The smallest, an Instinct E, crashed because it has no power reading; every model-dependent reading is now checked first.
- An offline map download: the Central Park loop’s map, 3.9 MB.
- The first launch, tapped through step by step. It caught a keyboard that stayed open from one step to the next, and a caption on the Ride tab that overlapped the cards behind it, both fixed.
Bluetooth, the watch link, Spotify and Apple Health permissions can’t be fully tested in the simulator, so they’re next, on the bike.
Outcome
Where it stands
As of October 2026, eight phases are built: 77 screens and 133 automated tests. It has been tested in the simulator, and real rides on my bike come next. Account backup, routing and Spotify each need a free account set up, and the watch field needs copying to the Garmin.
- (open larger image)
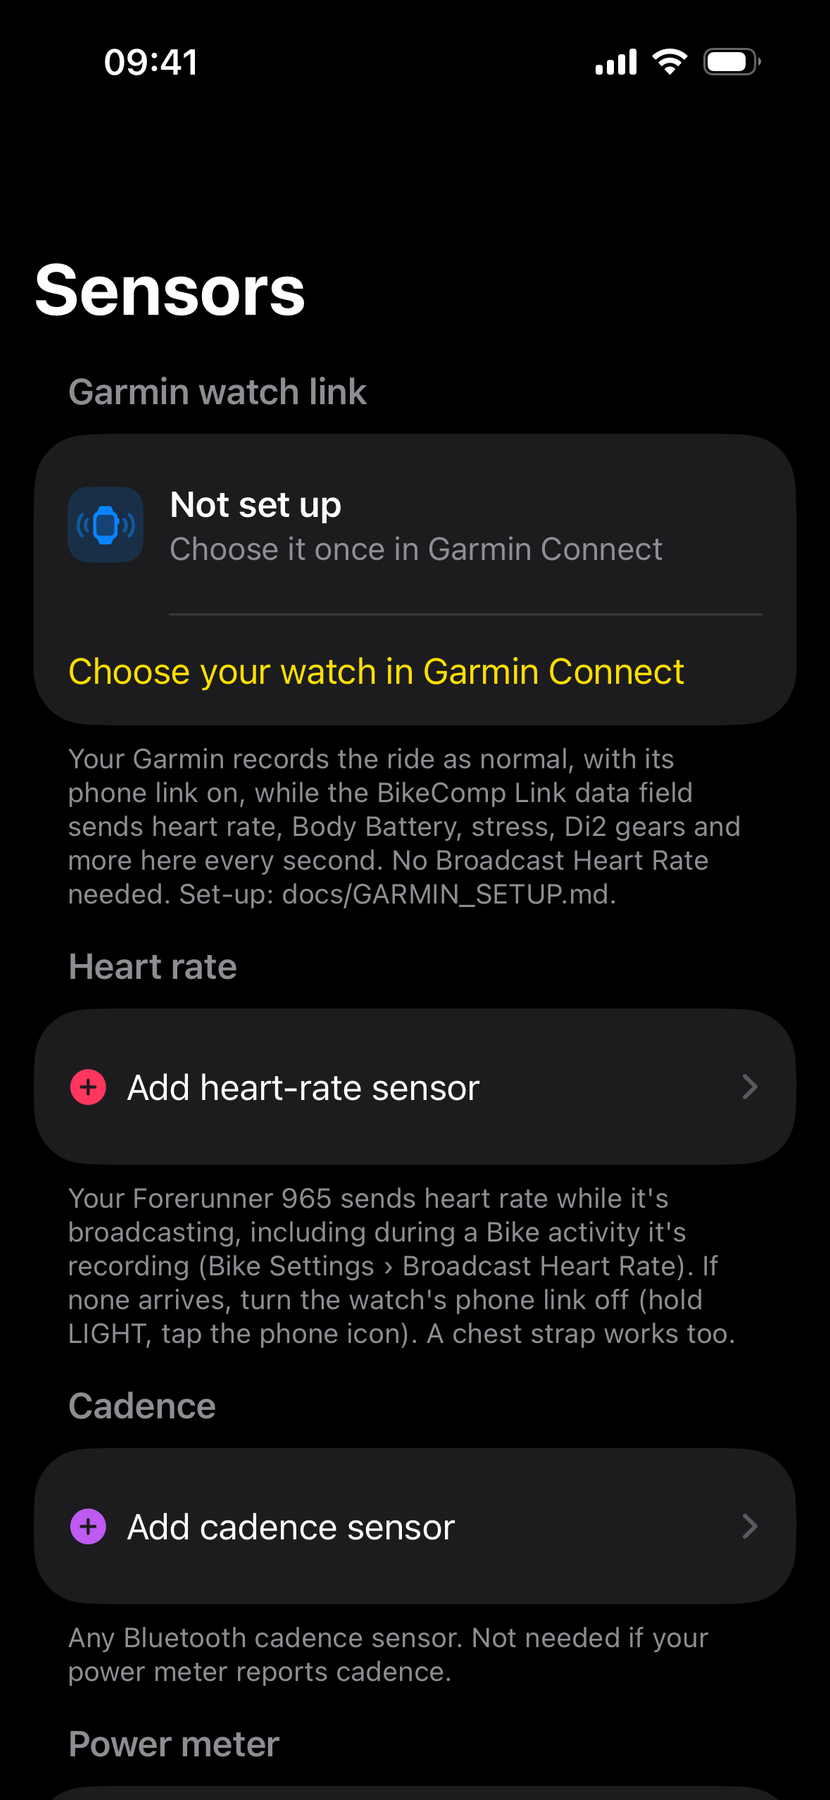
The Garmin link and Bluetooth sensors, set up in one place.
What’s next?
BikeComp is built, but it hasn’t been on a ride yet. This plan builds on work I’ve already started.
Now: onto the bike
- Ride it. Install it on my iPhone, put BikeComp Link on the watch, and test recording, the ride modes and turn wakes, navigation, music, earbud heart rate and offline maps on real rides.
- Switch on the accounts. Firebase for backup, a free OpenRouteService key for routing, and a Spotify developer app.
Next: researched, waiting on my decision
- Cadence. A cadence sensor gives the true number; the phone’s motion could only guess, and a Garmin data field can’t read raw motion at all.
- History from other wearables. Reading heart rate from Apple Health after a ride would cover Apple Watch, Whoop and Fitbit rides recorded elsewhere.
Later
- Strava. Automatic upload needs a Strava subscription; until then, rides export as files.
- Offline rerouting. Downloaded maps work without signal, but finding a new route still needs it.